Share of Voice in the AI Era: How Marketers Should Measure Visibility in ChatGPT, Gemini, and Perplexity
Discover how share of voice has evolved into AI visibility: learn to measure brand citations across AI search platforms and benchmark competitors.

What Is Share of Voice in AI Search? A Practical Guide to AI Visibility
Share of voice used to mean your slice of media impressions or search rankings against competitors. In the AI era, it means how often generative engines like ChatGPT, Gemini, Claude, and Perplexity cite, mention, or recommend your brand when answering real customer questions. To be precise from the outset: I define AI share of voice as your brand's weighted share of citations and mentions across a fixed set of purchase-decision queries, measured against named competitors on the same query set. It's an operational comparison metric, not a universal measure of impressions or market demand, and it shouldn't be mistaken for one.
I've spent a considerable amount of time this year reconciling old measurement frameworks with new AI search behaviour, largely because I think a lot of UK marketing teams are currently reporting AI visibility numbers to leadership without a clear methodology behind them. That's a credibility risk. Below, I'll walk through the definitions, the actual formula, and a worked example, because vague methodology is exactly what erodes trust in this metric.
Share of voice: from media impressions to AI search visibility
Traditional share of voice measured a brand's proportion of total media mentions, advertising exposure, or category conversation relative to its competitors. Nielsen and comScore built entire measurement businesses on quantifying this: impressions from a TV spot, column inches secured by PR, or ranking position on a search engine results page for a defined basket of keywords. It was countable, and static enough to trend week over week with confidence.
Then came the shift from "share of shelf" to "share of search," as Google became the first, and often only, research stop for most category decisions. That was still fundamentally a ranked-list problem: ten blue links, a position, a click-through rate you could model.
AI search breaks that model. There's no ranked SERP inside a ChatGPT or Perplexity answer, and no fixed inventory of ten positions to count. Instead there's a generated, conversational answer that either includes your brand or doesn't, and that inclusion can vary from one run of the exact same prompt to the next. Princeton and Georgia Tech researchers, in a 2024 paper on generative engine optimisation (arXiv:2311.09735), describe how AI-generated answers compress the consideration set into a synthesised response containing only a handful of brands or sources, rather than a page of ranked results. The practical upshot: "share" in AI search has to be redefined around presence and frequency, not position alone.
So here is the measurement unit I use, stated plainly before we go further: AI share of voice = your brand's weighted mention count across a fixed query set, divided by the total weighted mention count for all tracked brands across that same query set, over a defined time window. Everything below is an explanation of how each part of that formula actually works.
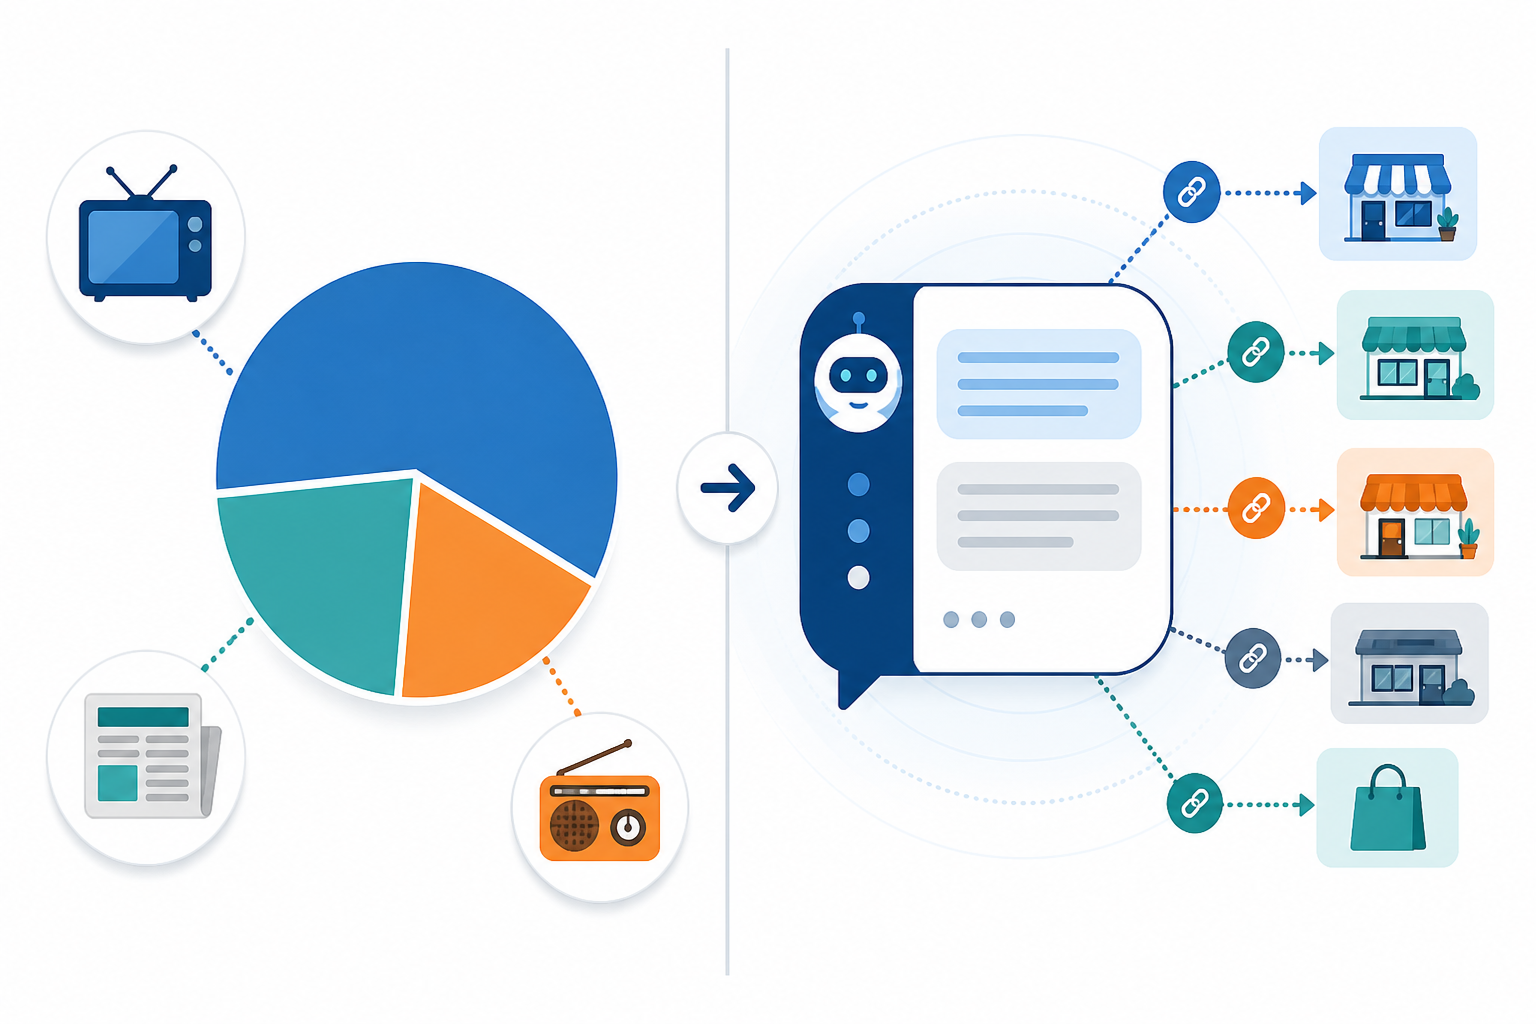
How AI citation frequency becomes a share of voice metric
Before any calculation is credible, the mention types need firm definitions, because "citation," "mention," and "soft mention" get used loosely across the industry and I want to be explicit about how I classify each:
- Linked citation: the model names your brand and provides a source link or footnote pointing to your content specifically.
- Unlinked mention: the model names your brand in the prose of its answer with no accompanying source link or citation marker.
- Soft mention: the model references your category or offering in a way that clearly implies your brand without naming it directly (for example, describing a feature only your product has). I log these separately and weight them lowest, because attribution is inferred rather than explicit.
A source that's cited but never names your brand doesn't count as a mention at all under this framework, citation of your domain without brand attribution in the visible answer text is a different signal (worth tracking, but not part of the SOV numerator).
When I run the same query daily across ChatGPT, Claude, Gemini, Copilot, and Perplexity, agreement between platforms is inconsistent rather than the norm, a pattern also noted in early AI search auditing tools, since each engine pulls from different indexes, weights sources differently, and updates on its own cycle. Perplexity's format makes source attribution explicit through visible citations, while a brand can be named in a ChatGPT response with no citation at all. That's why I track citation share and mention share as separate figures rather than folding them into one blended number.
Position matters as much as presence. Being named third in a five-brand answer isn't equivalent to being the sole brand a model recommends, so I apply a simple position weight: first-mentioned or sole-recommended brand = weight of 3; second or third position in a multi-brand answer = weight of 2; mentioned later in a longer list, or as a soft mention = weight of 1. If your brand appears twice within the same answer, I count the higher-weighted instance only, to avoid one verbose answer skewing the total.
It's worth separating this SOV calculation clearly from a second, related idea: a composite visibility score. At MentionOwl, where I work, we also track a 0-100 visibility score that blends query coverage, position-weighted citations, share of voice, and soft mentions into a single number for tracking direction over time. I want to be explicit that this is a proprietary composite KPI, not a redefinition of share of voice itself: SOV is the citation-share formula above, and the visibility score is a separate, blended index built on top of it. I'm flagging that distinction because collapsing the two is one of the more common mistakes I see in how teams report this data upward, and I don't want to repeat that mistake here by implication.
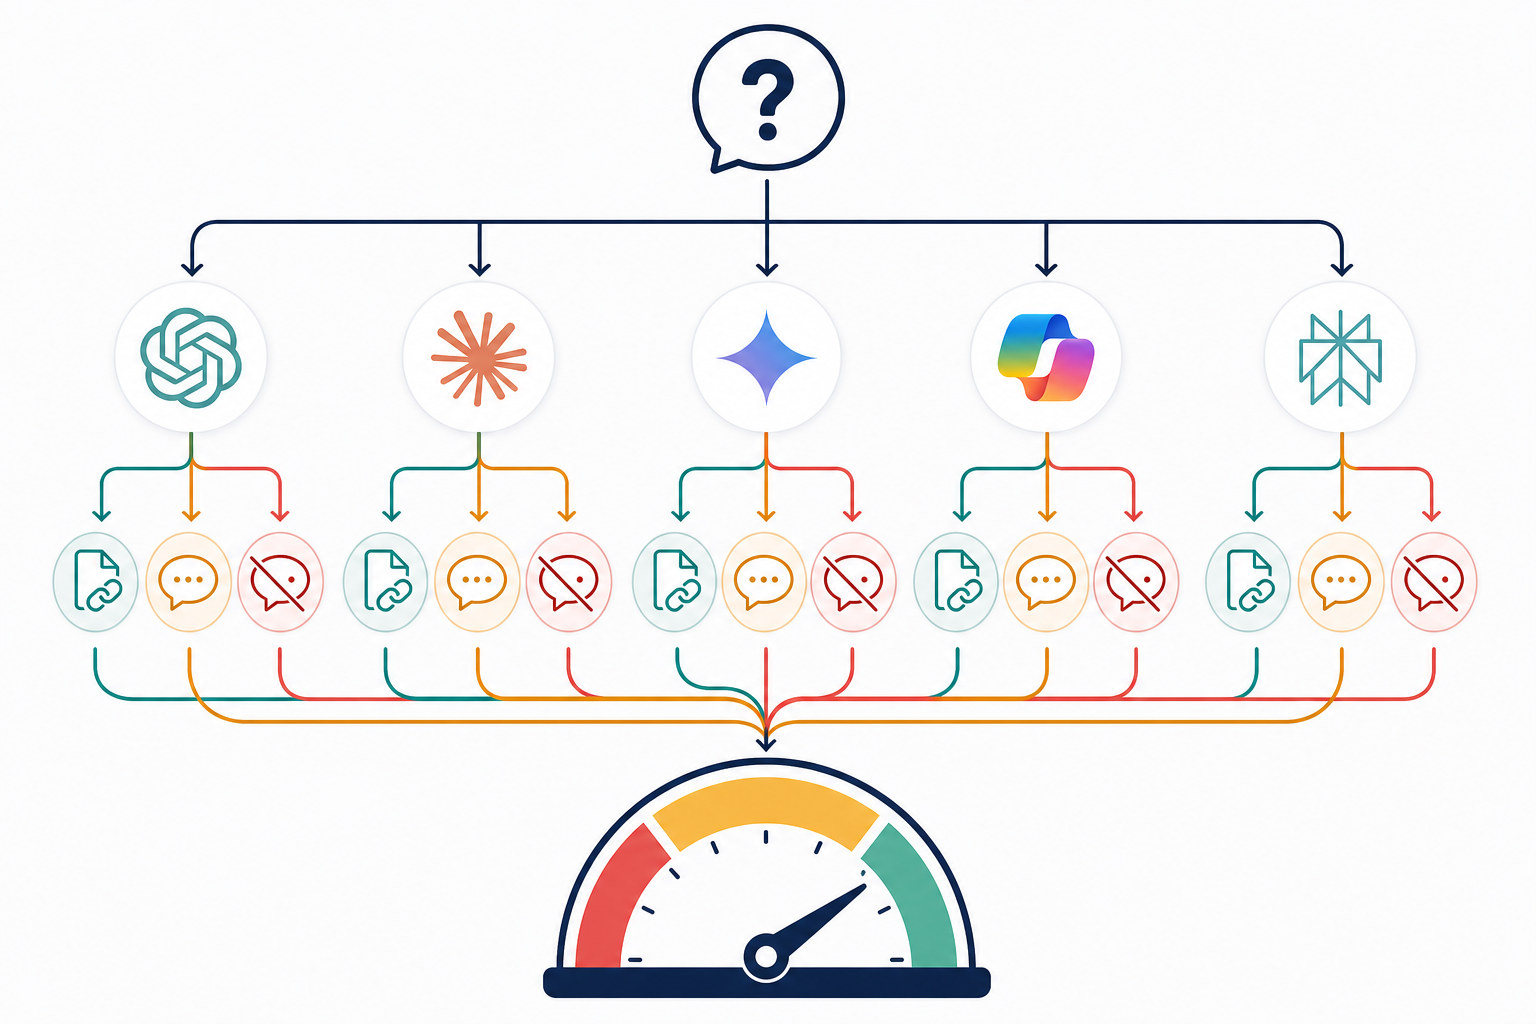
How to calculate AI share of voice across AI platforms
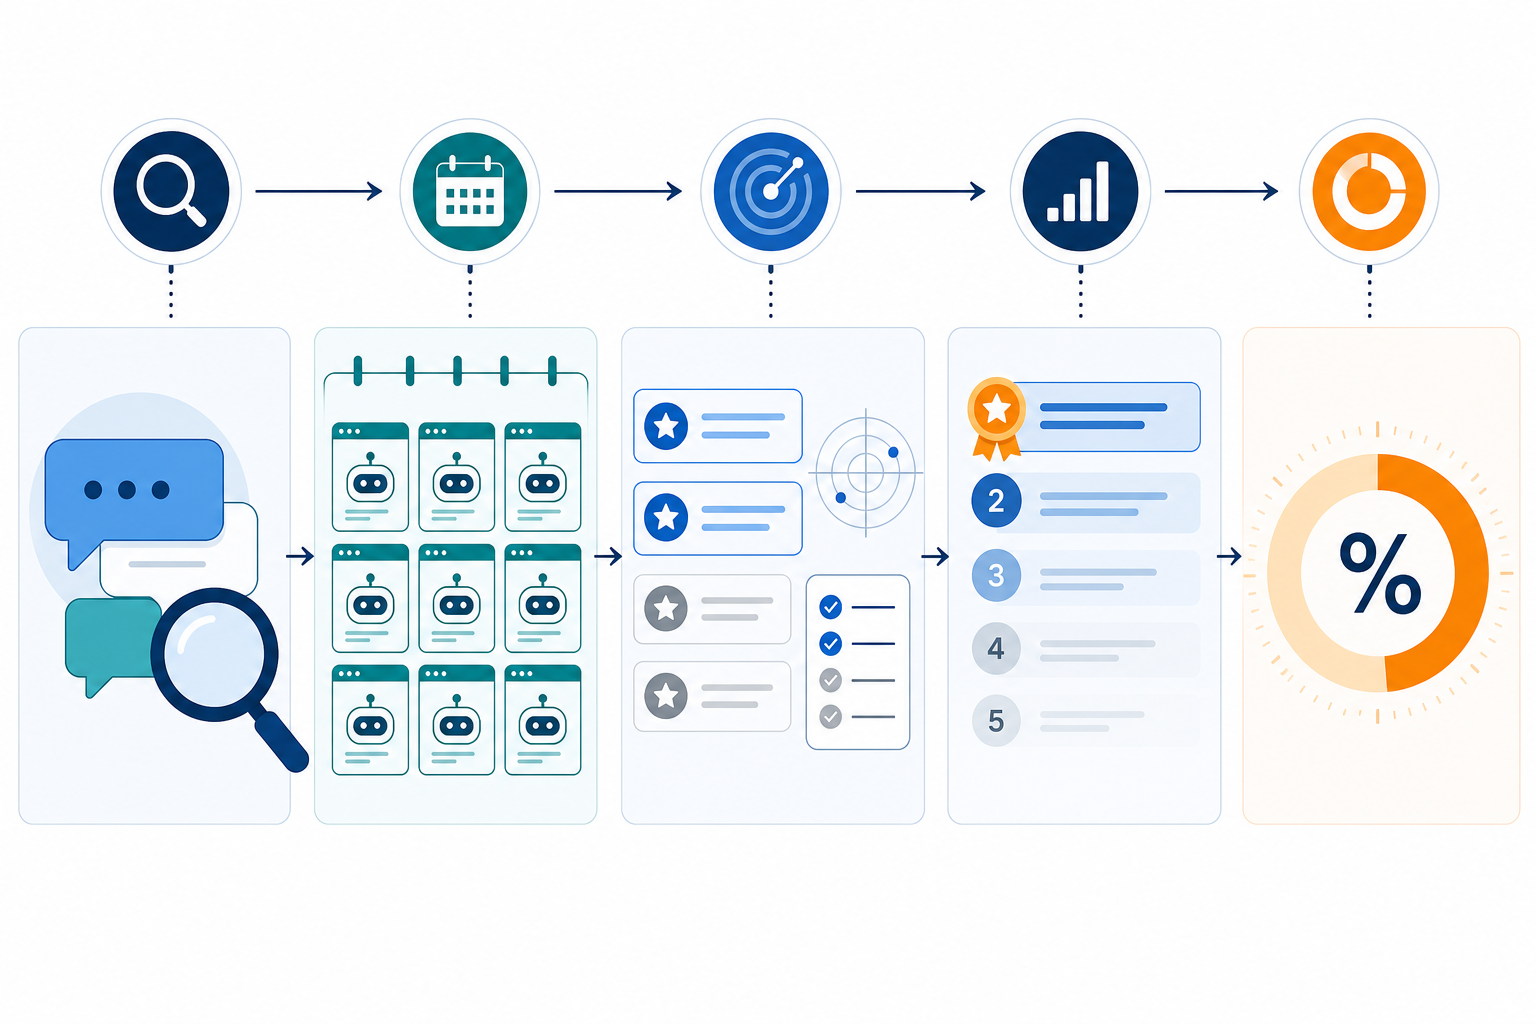
Here's the methodology step by step, including the parts that are usually left vague:
Build a query set that mirrors real purchase-decision language, not just branded searches for your company name, for example, "best project management software for a 30-person UK agency" or "alternatives to [category leader] for VAT-registered small businesses." Localise the language: UK buyers often phrase decisions differently from US buyers, using British spelling, GBP pricing context, and UK-specific comparison points (FCA-regulated, HMRC-compliant, and so on, where relevant to the category).
Run that query set against each AI platform on a consistent cadence, and log the model version and date with every run. I run mine daily, mainly because I've observed output drift as underlying models and their source sets update, but daily cadence is a monitoring choice suited to a fast-moving category or a live campaign, not a universal requirement. If your category moves slowly, a twice-weekly run captures most of the same signal at a fraction of the operational cost. Match cadence to how quickly your competitive set actually changes.
Record every instance your brand appears, classified by type (linked citation, unlinked mention, or soft mention per the definitions above) and logged with its position weight.
Repeat the identical process for each named competitor, using the same query set, run on the same day. Without this step, you have visibility data, not share-of-voice data. The two are not interchangeable.
Sum the weighted mentions for your brand and divide by the total weighted mentions across all tracked brands to arrive at a percentage. If a query returns an untracked brand (one outside your named competitor set), I still count it in the denominator, because excluding it would artificially inflate everyone's share. It simply doesn't get a numerator of its own unless you choose to add it to your tracked list.
A worked example: Say I run the query "best CRM for a UK SaaS startup" once across five platforms. Brand A (mine) receives one linked citation in first position (weight 3), one unlinked mention in third position (weight 2), and one soft mention (weight 1), total weighted mentions: 6. Competitor B receives two first-position linked citations across two other platforms (weight 3 each) and one third-position mention (weight 2), for a total of 8. Competitor C receives one soft mention (weight 1). One platform names an untracked brand D, which counts toward the denominator but has no numerator of its own. Total weighted mentions across all brands: 6 + 8 + 1 = 15. Brand A's share of voice for this single query: 6 ÷ 15 = 40%. Run across your full query set and averaged over your chosen time window, that's the number I'd report.
- Segment the results by platform. A brand's Perplexity share can look nothing like its ChatGPT share, because Perplexity's citation-heavy format rewards well-structured, frequently referenced content differently than ChatGPT's more conversational synthesis does. Show leadership the split, not a single blended average that hides where you're actually strong or weak.
Benchmarking AI share of voice against direct competitors
Industry-wide benchmarks for AI share of voice are still immature, and that's worth saying plainly. If anyone quotes you "good AI SOV is 30%" as a cross-industry figure, treat that claim with real scepticism. The data infrastructure to support a defensible cross-industry number doesn't yet exist, and AI answer behaviour varies too much by category, geography, and platform for a single benchmark to be meaningful. This matters particularly for a UK-focused brand, since most of the large published datasets on AI search behaviour to date are US-centric, and model behaviour, source weighting, and even platform availability can differ by market.
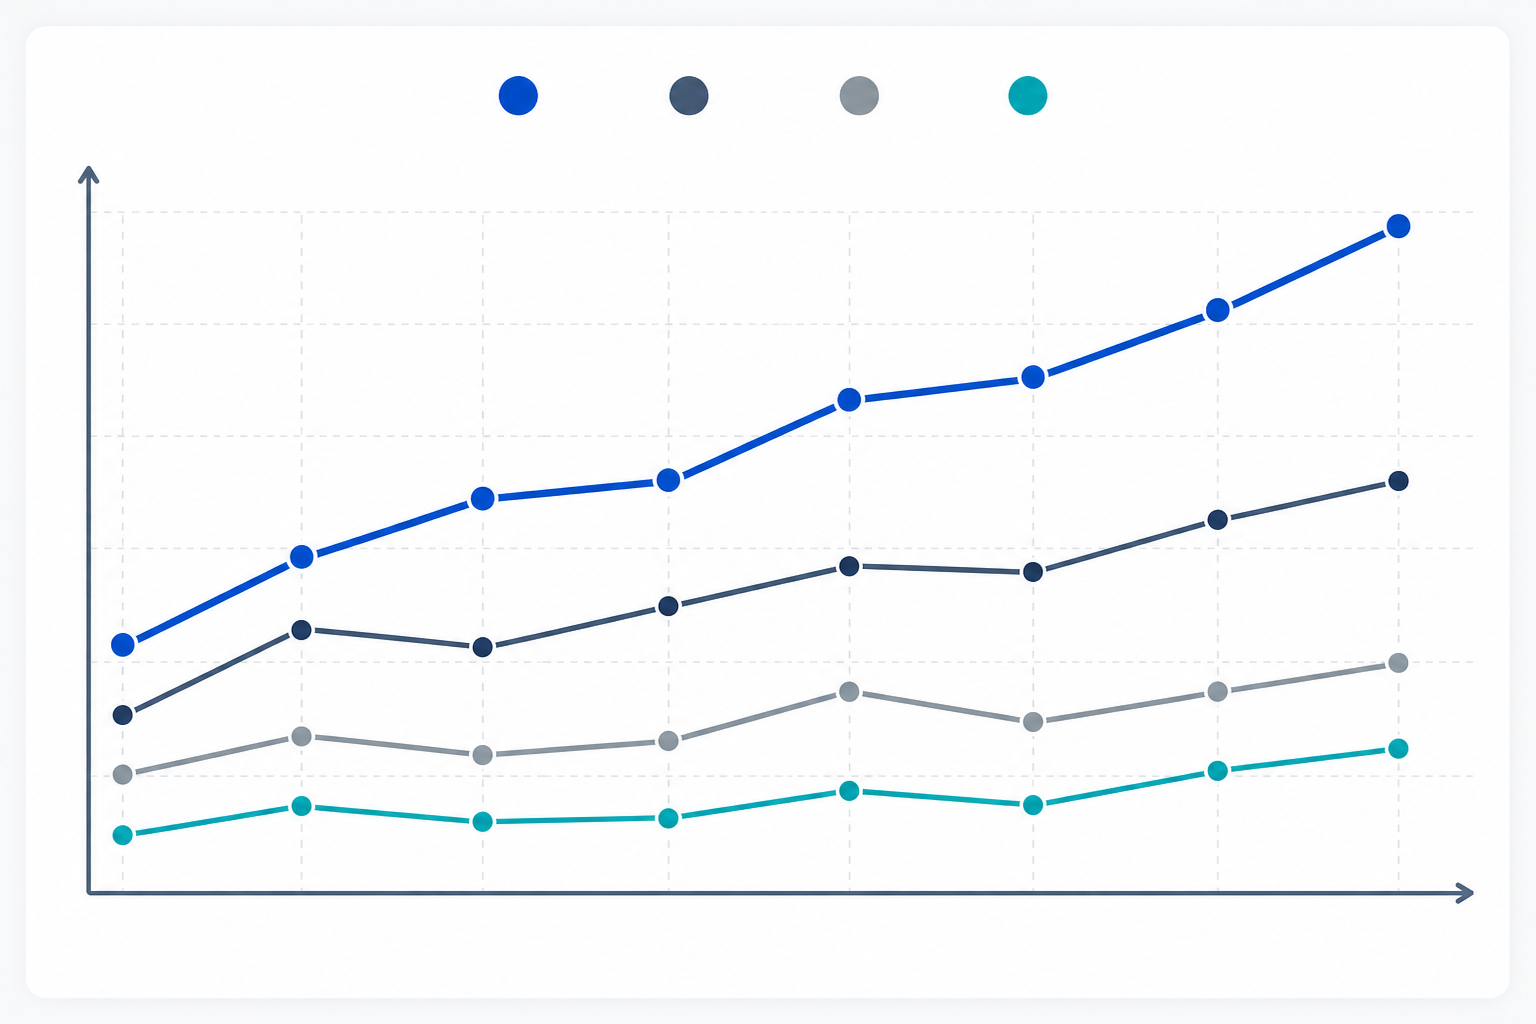
A more useful approach is benchmarking against your own three to five closest competitors, using the exact same query set. Choose that competitor set deliberately: include the category leader even if they dominate the answers (their presence tells you the ceiling), one or two direct rivals of similar size, and avoid changing the competitor list mid-trend, since that breaks comparability across your reporting window. If you're tracking UK search behaviour specifically, make sure your query set reflects UK buying journeys and UK-relevant competitors rather than defaulting to a US-weighted category list.
Because AI answers are prompt-sensitive, small changes in wording, geography, or freshness requirements can shift which brands get mentioned. That's precisely why a fixed prompt set and a consistent competitor set are essential to any comparison that's going to hold up under scrutiny. Track the trend over four to eight weeks minimum before drawing conclusions; given how much model outputs vary run to run, a single-week dip or spike is frequently noise rather than signal, and I'd treat any one-week swing as provisional until it holds for at least two consecutive weeks.
Competitor tracking also surfaces something raw share numbers alone won't show: sentiment gaps. You might have citation frequency comparable to a competitor, but if the framing around your brand is consistently lukewarm while theirs is enthusiastic, that's a meaningfully different competitive position than the percentage alone suggests. I don't report share of voice without a sentiment layer sitting next to it. The two together tell a story that neither tells alone.
How to report AI visibility without overselling it
There's real risk in either direction here: dismissing AI visibility as immature and irrelevant, or overselling a single number as proof of revenue impact it hasn't yet demonstrated.
Frame it as a leading indicator of AI-driven discovery, not a proven revenue driver. The causal chain from AI citation to purchase is still being established industry-wide. Pew Research Center's 2025 analysis of Google search logs found that when AI Overviews appeared, users clicked through to a traditional web result in about 8% of visits, compared with roughly 15% of visits without an AI summary, and clicked a link inside the AI overview itself in around 1% of visits (Pew Research Center, "Google users are interacting differently with search results due to AI", 2025). That's a real signal that visibility and click-through traffic are decoupling, which is exactly why this metric needs careful framing rather than a straight line drawn to revenue.
Pair the share-of-voice number with cookieless AI traffic analytics so leadership sees visibility and actual downstream visits together. Adobe's 2024 US holiday retail data reported generative-AI referral traffic to retail sites up more than 1,200% year over year (Adobe Analytics, 2024 Online Shopping Trends). That figure is US-specific and holiday-period-specific, so I'd treat it as directional evidence of a broader shift rather than a number to extrapolate directly onto a UK retail calendar. It's still a useful data point for why traffic is arriving via AI channels at all.
Match reporting cadence to the audience's decision-making rhythm, and be honest about the trade-off: daily tracking is a working tool for the team monitoring trends internally, not a boardroom slide. Use weekly digests for the marketing team, and monthly or quarterly rollups for leadership.
Always show the query sample size and platform breakdown alongside the headline percentage. A 34% share of voice built on 20 queries across two platforms means something different than the same figure built on 200 queries across five. Stakeholders deserve to know which one they're looking at.
Avoid presenting a single 0-100 visibility score as the whole story. It's useful for tracking direction over time, but the underlying components (coverage, position, sentiment) are what actually drive the actions your team takes next. The score tells you something changed; the components tell you what to do about it.
A simple reporting template I'd suggest for a leadership deck:
- Headline AI share of voice (%) for the period, with query sample size stated.
- Query coverage, what proportion of your tracked queries surfaced your brand at all.
- Platform split, your share on each of the five platforms, not a blended average.
- Trend line over the last 4–8 weeks against your three to five named competitors.
- One line on limitations, sample size, sentiment context, and the caveat that this is a leading indicator, not a revenue figure.
FAQ: AI share of voice and AI search measurement
Is AI share of voice comparable to traditional media share of voice?
Conceptually, yes: both measure your presence relative to competitors within a total pool of attention. Mechanically, no. Traditional SOV counted impressions or ad spend across fixed inventory; AI share of voice counts weighted citation and mention frequency across probabilistic, conversational answers that can vary run to run on the identical prompt. Treat AI SOV as a related but distinct metric, not a drop-in replacement you can trend against your old media SOV charts without a note explaining the methodology shift.
How is AI share of voice calculated?
Build a query set from real customer questions, run it consistently across each AI platform, and record every mention, weighted by position and citation type (linked citation, unlinked mention, or soft mention), for your brand and each named competitor. Sum your brand's weighted mentions and divide by the total weighted mentions across all tracked brands, including any untracked brands that appear in the denominator. Repeat over a four-to-eight-week window before drawing conclusions. This is the general framework behind most AI visibility monitoring tools, including the one I work on, though the specific weighting choices will vary by provider.
What's a realistic AI share of voice benchmark for my industry?
There's no reliable published industry standard yet, since AI search behaviour is too new, too platform-dependent, and too geography-dependent for a single number to be meaningful. This is especially true for UK brands, given that most published datasets skew US-centric. The more defensible approach is benchmarking against your own three to five closest competitors on identical queries, judging your trend line over four to eight weeks rather than chasing an external figure.
How often should AI share of voice be reported?
Track as often as your category and resourcing justify, daily if you're monitoring a fast-moving competitive set or an active campaign, weekly or fortnightly if your category shifts more slowly. Report weekly digests to the marketing team and monthly or quarterly rollups to leadership; daily granularity is a useful internal working tool but too noisy for a board deck without the context of a longer trend line behind it.