How Marketing Teams Can Use AI Visibility Data in QBRs: A Template Walkthrough
Turn AI visibility data into a leadership-ready QBR slide with share of voice, competitor benchmarks, key metrics and clear next-quarter goals now.
How to turn AI visibility data into a leadership-ready QBR slide
A strong QBR slide on AI visibility data needs three things: a headline visibility score with quarter-on-quarter movement, a share-of-voice comparison against named competitors, and one clear narrative explaining what changed and why. After building reporting frameworks for marketing teams that track how brands show up in ChatGPT, Claude, Gemini, Copilot and Perplexity, I've found that leadership doesn't want raw data dumps. They want the same rigour they'd expect from a paid search report, applied to generative AI channels.
This is a genuine shift in what boards ask for, and I want to walk through exactly how to build that slide, which metrics deserve a place on it, and how to turn a quarter's worth of AI visibility data into a narrative that survives tough questions from a CMO or CEO who's never heard the term 'generative engine optimisation' but instinctively understands share of voice.
Why leadership now cares about AI visibility data
I've watched this concern move from an 'interesting side project' to a standing agenda item in the space of about eighteen months, and the underlying numbers explain why. Gartner has predicted that traditional search engine volume will drop 25% by 2026 as users shift towards AI chatbots and virtual assistants. That's a forecast, not a confirmed outcome, but it's already shaping budget conversations across UK marketing departments. McKinsey's global surveys back up the adoption curve on the business side too: 65% of organisations reported regularly using generative AI in at least one function in 2024, up from 33% the year before, and that figure climbed to 78% by 2025. When your own leadership team is using ChatGPT weekly, they stop asking hypothetically about AI visibility and start asking specifically about your brand's position in it.
There's a structural reason this matters beyond adoption statistics, though. AI-generated answers can compress the entire consideration journey: a user might get a shortlist, a comparison or a direct recommendation without ever clicking through to a website. Adobe's analysis of US retail traffic found generative-AI referrals increased by 1,200% between July 2024 and February 2025, and that these AI-referred sessions were 23% more engaged than traffic from other sources, based on time spent and pages viewed. That's a meaningful signal that being recommended inside an AI answer can influence demand even before it shows up as a click in your analytics.
Boards have asked 'are we ranking on Google?' for two decades. I think we're now at the point where 'are we showing up in AI answers?' is asked with the same seriousness, and increasingly, with the same expectation of a rigorous answer. Ahrefs found that the presence of an AI Overview was associated with a 34.5% lower click-through rate for the top-ranking organic result in its 2025 study, which tells you why traditional organic reporting alone no longer satisfies that question. That shift, from SEO reporting to AI SEO and generative engine optimisation, isn't cosmetic. A meaningful share of purchase-decision research now happens inside a chat interface rather than a results page.
The risk framing is the part that gets leadership's attention fastest. If a named competitor is being cited and recommended in AI answers to the exact questions your buyers are asking, and you're not, that's not a future problem. It's a pipeline risk accumulating quietly in the present. I'd argue this is precisely the kind of risk a QBR exists to surface before it becomes a lagging revenue explanation.
Which AI visibility metrics should you include on a QBR slide?
One mistake I see marketing teams make constantly is trying to show leadership everything they've collected. A QBR slide isn't a dashboard export. It's a curated argument, and I'd cap it at four or five metrics maximum. Here's what earns a place:
- A 0-100 visibility score is the headline number. MentionOwl builds this from query coverage, position-weighted citations, share of voice and soft mentions, giving leadership a single figure they can track quarter on quarter without needing to understand the underlying methodology.
- Citation frequency by AI platform matters because ChatGPT, Claude, Gemini, Copilot and Perplexity each pull from different sources and behave differently. A platform-by-platform breakdown stops leadership from assuming one chatbot's behaviour represents the whole AI search landscape.
- Sentiment trend alongside mention volume matters too. A rising mention count paired with negative or inaccurate sentiment isn't a win; I'd argue it's worse than low visibility, because it means AI engines are actively representing your brand poorly to prospects.
- AI legibility audit results are worth including as well. MentionOwl's 16 technical checks often surface fixes (structured data gaps, unclear product pages, missing FAQ schema) that precede visibility gains by a matter of weeks. This gives leadership a 'here's what we did' story rather than a passive report of numbers moving on their own.
- Cookieless AI traffic analytics answer the question leadership will inevitably ask: is any of this translating into actual site visits? Even directional numbers here connect visibility to something commercially tangible.
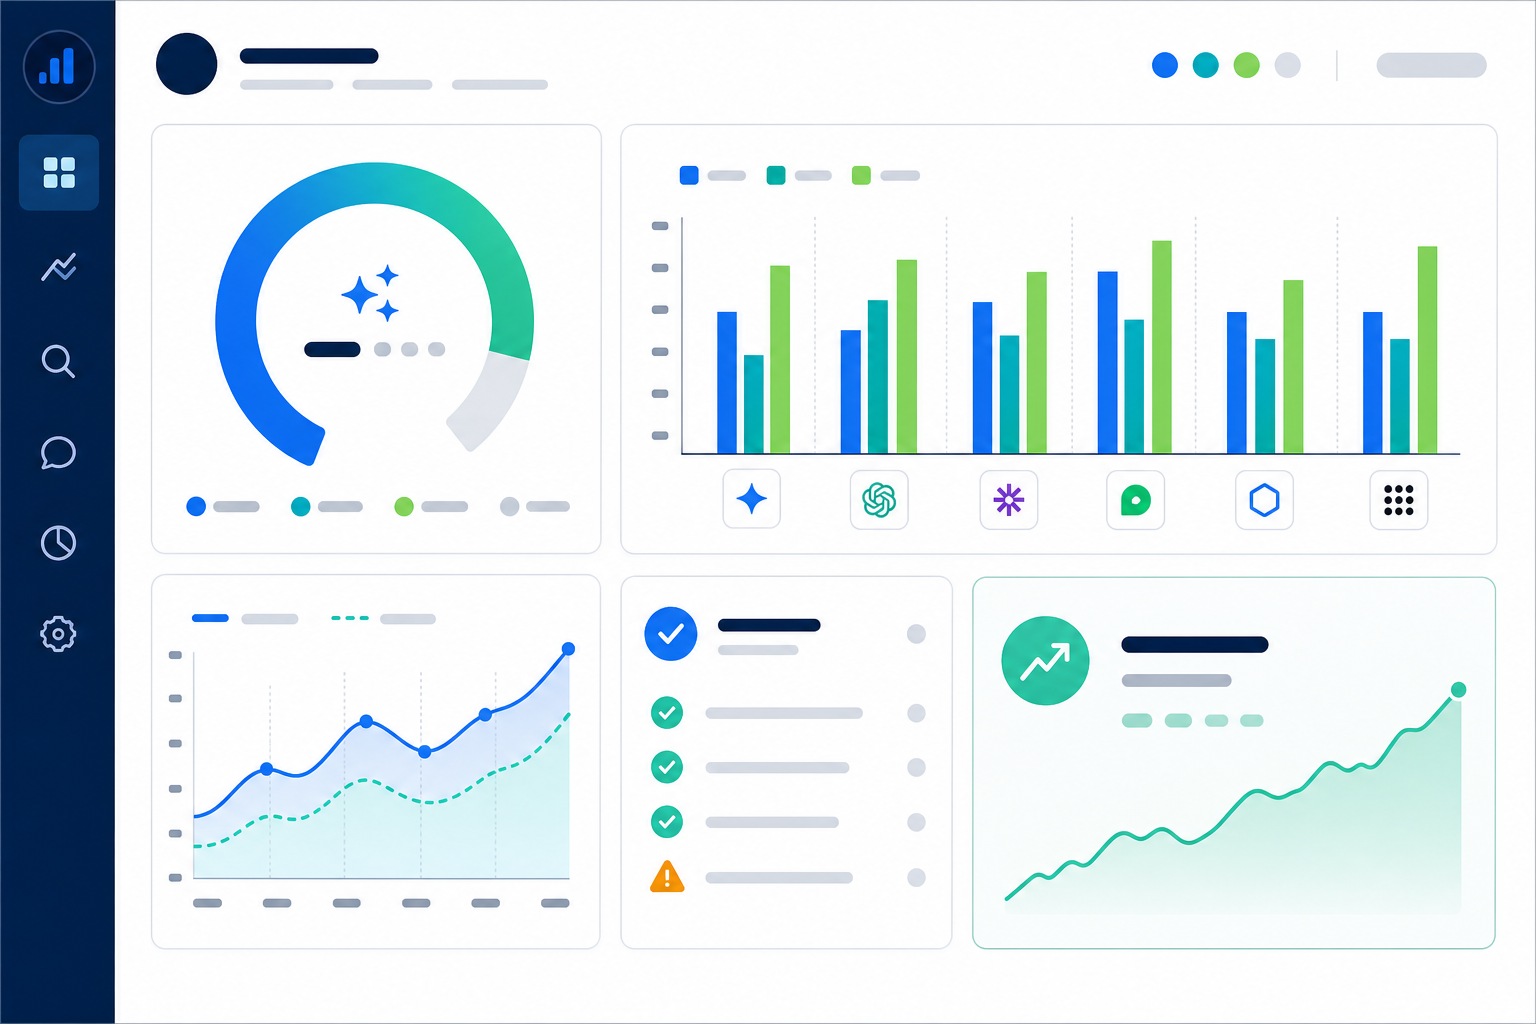
I'd resist the temptation to add competitor names, granular query lists or platform methodology notes to this particular slide. Those belong in an appendix or a follow-up conversation, not the headline view.
How to tell a story with share-of-voice trends
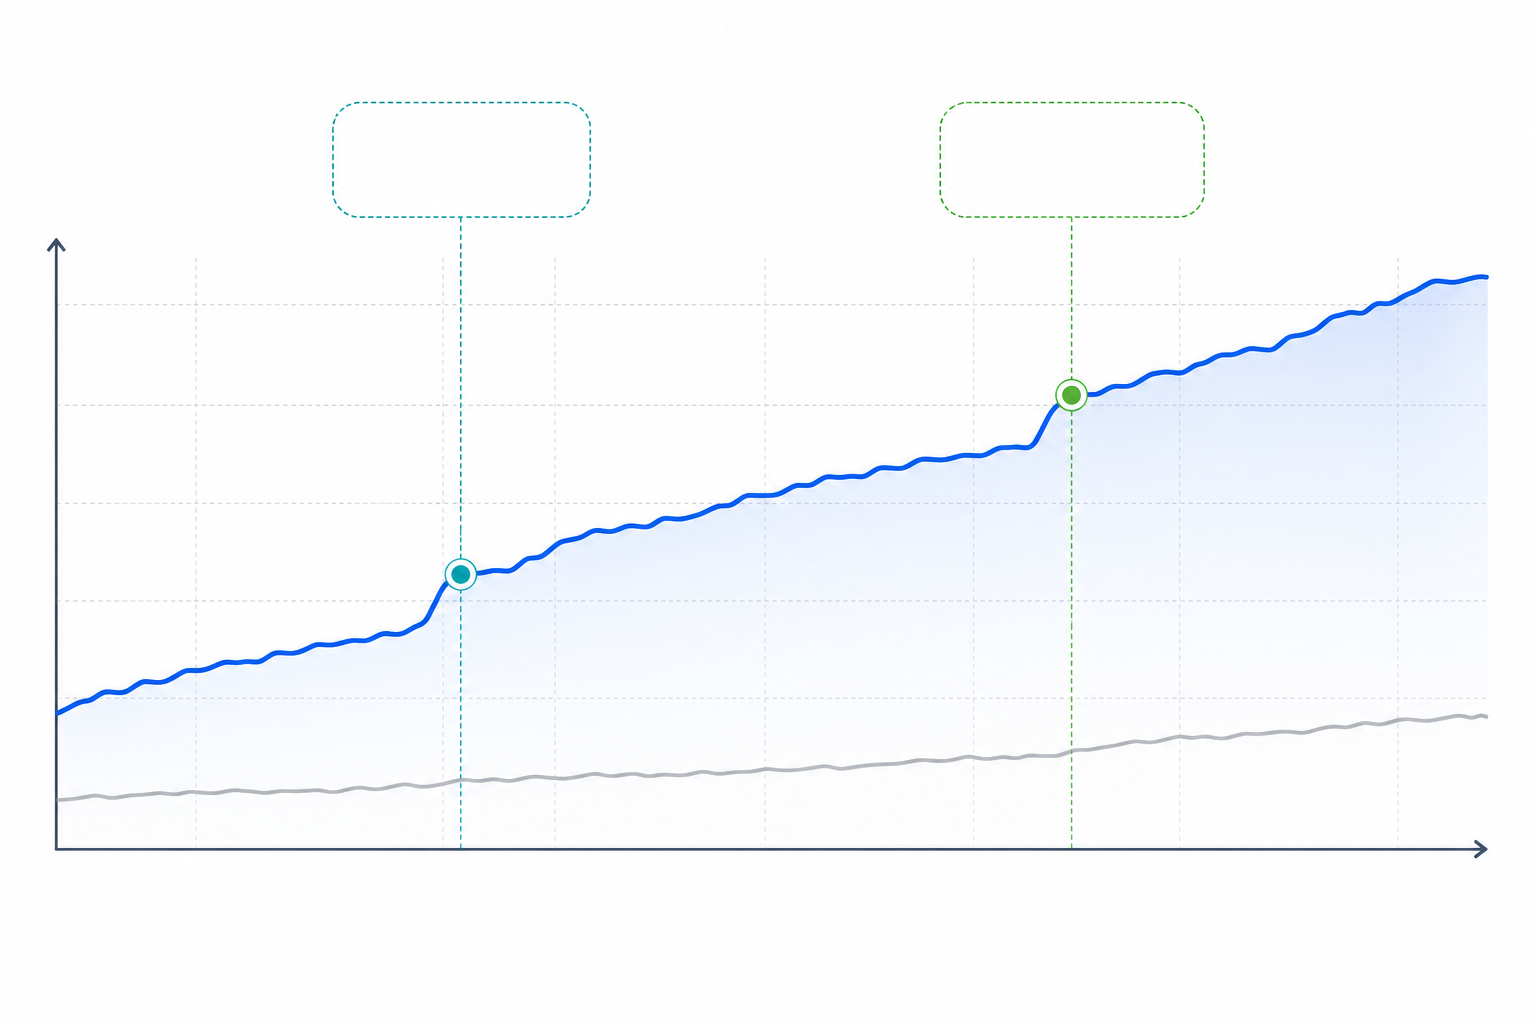
A single snapshot number, 'our visibility score is 42', tells leadership almost nothing on its own. What persuades a room is a 90-day trend line showing direction of travel, because it answers the question every executive is silently asking: is this getting better or worse, and because of what?
I structure this narrative in three beats every quarter:
- Starting position: where share of voice sat at the start of the period, ideally against the same competitor set used in the previous QBR so the comparison holds.
- What we did: the specific interventions, such as content published, schema fixes from an AI legibility audit, FAQ pages restructured and product pages clarified.
- Resulting shift: the movement in share of voice that followed, ideally timestamped closely enough to the intervention that the causal link feels credible rather than coincidental.
This is where weekly digest data earns its keep. Rather than presenting a vague 'visibility improved over the quarter', I can point to the exact week a legibility fix went live and the exact week citation share began climbing in response. That specificity matters enormously when a CFO or CEO asks, 'how do you know this was because of what we did and not just noise in the model?' Being able to say, 'the shift started the week after we corrected our pricing page schema and held for six consecutive weeks', is a fundamentally stronger position than a single before-and-after comparison.
I'd also flag, in the interest of intellectual honesty, that AI answers are probabilistic. They vary by model, geography, device and even the exact wording of a prompt. A repeated, fixed query set run daily, which is how MentionOwl's monitoring works, gives you a defensible sample rather than a single lucky or unlucky snapshot. That's worth explaining briefly to leadership so they don't over-interpret week-to-week noise.
How to benchmark AI visibility against competitors
Vague industry averages don't survive scrutiny in a QBR. 'We're roughly in line with the category' invites the follow-up question, 'in line with whom, specifically?' If you can't answer that immediately, the credibility of the whole report weakens. I'd set up competitor tracking against three to five named rivals, chosen because they're the ones leadership already thinks about when discussing market position, not because they're convenient to monitor.
The comparison that actually matters is share of voice, not raw mention count. A competitor can be mentioned in AI answers frequently while rarely being the one actually recommended. Mentioned in a comparison list versus named as the top pick are very different competitive positions, and conflating them overstates or understates real risk.
| Metric | Your Brand | Competitor A | Competitor B |
|---|---|---|---|
| Visibility score (0–100) | 58 | 51 | 44 |
| Citation rate | 34% | 41% | 22% |
| Sentiment score | Positive | Mixed | Positive |
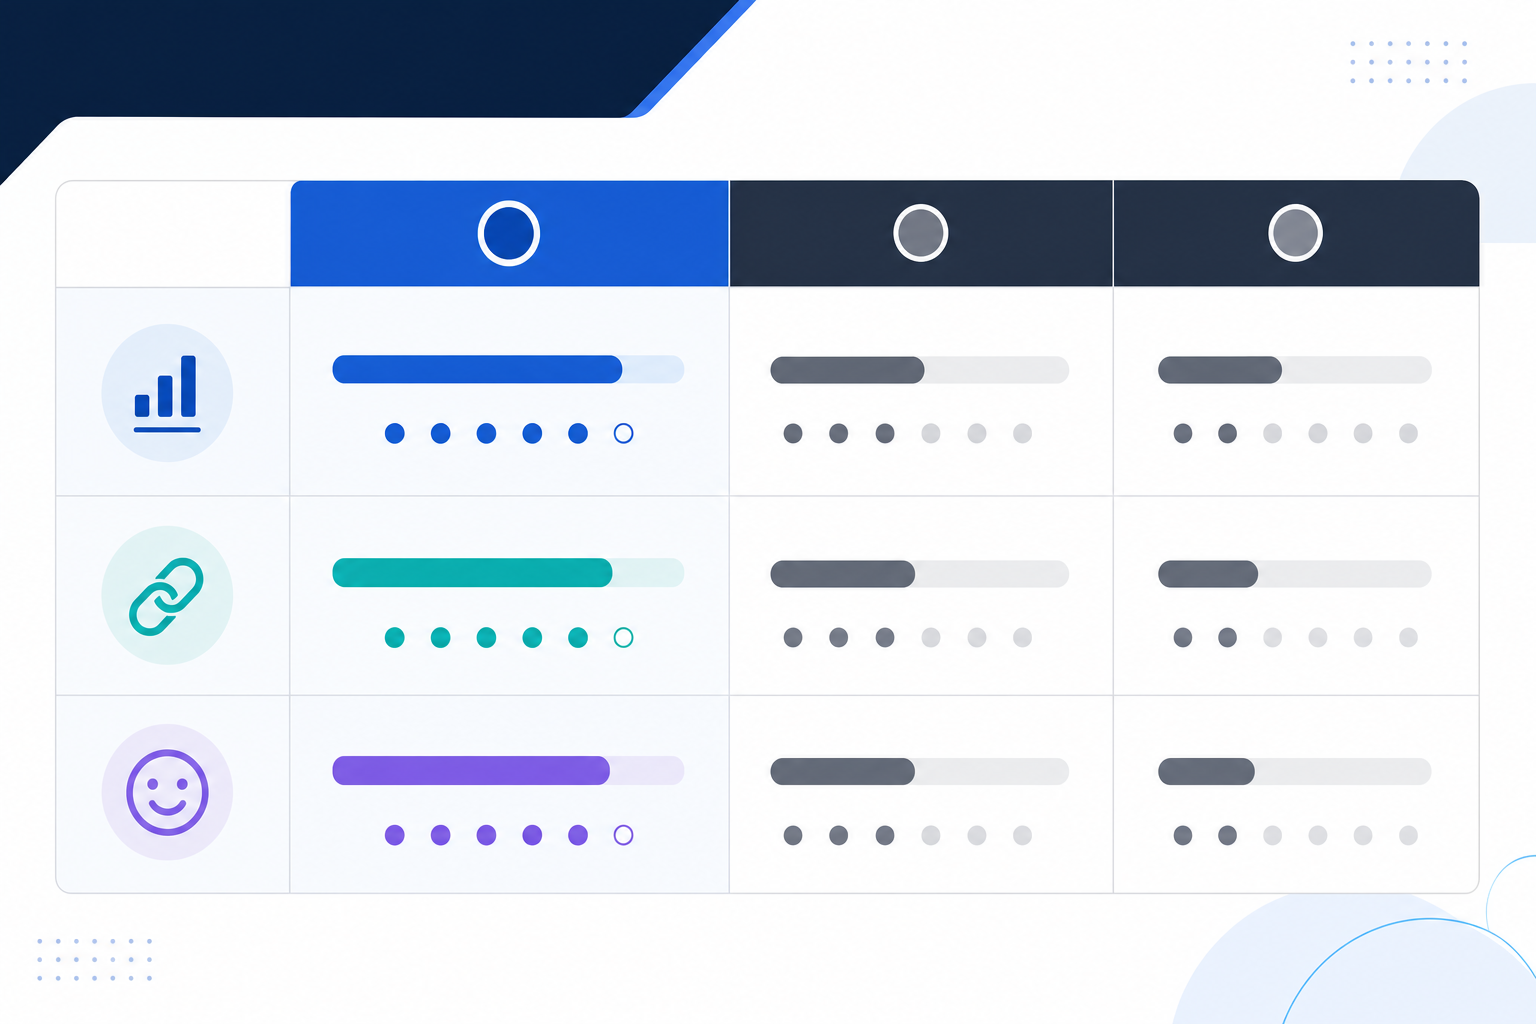
The most valuable part of this exercise, in my experience, is the gap analysis underneath the table, not the table itself. Where is a competitor winning citations for query categories you don't yet rank for at all? Those queries become next quarter's content brief almost automatically. This is one of the clearest ways AI visibility data earns its place in a QBR. It generates a prioritised action list for the next 90 days, not just a report of the past.
How to set next-quarter AI visibility goals
A QBR that ends with data and no forward commitment wastes the room's time. I'd close every AI visibility review with a short, specific action plan:
- Identify the two or three weakest query categories from your auto-generated question set: the topics where coverage is lowest, not the ones that are simply easiest to fix.
- Set a specific visibility score target, such as 'move from 58 to 65 by the end of Q3', rather than a vague ambition like 'improve our AI presence'. Specific targets are the difference between an accountable goal and a hopeful one.
- Assign named owners for the legibility fixes flagged in the technical audit (schema corrections, page restructuring, FAQ additions), since these are concrete, deadline-able tasks that someone on the team needs to own.
- Agree a refresh cadence for pulling fresh data before the next QBR, so the numbers presented aren't a quarter stale on the day they're shown.
- Build in a mid-quarter check-in using weekly digest data, so a sudden drop in visibility or a competitor's citation surge gets caught and addressed before it becomes an uncomfortable surprise at the next review.
This last point matters more than it might initially seem. AI visibility can shift quickly: a competitor's product launch, a change in how a model weights certain sources, or a technical issue on your own site can all move the number. A team that only checks in quarterly risks discovering a three-month decline all at once, in front of leadership, with no explanation ready.
Frequently asked questions about AI visibility reporting
What AI metrics should I show leadership in a QBR?
Keep it to four or five: your overall visibility score, share of voice against named competitors, sentiment trend, citation breakdown by AI platform and a brief note on AI legibility fixes completed that quarter. Anything more tends to dilute the narrative rather than strengthen it.
How do I benchmark AI visibility against competitors?
Use competitor tracking to follow three to five named rivals rather than an industry average, and compare share of voice and sentiment side by side, not just raw mention counts. A table format works well because leadership can scan it in seconds.
How often should I refresh AI visibility data before a QBR?
I'd recommend pulling fresh data within the week before your review, since AI engines update their training data and retrieval sources frequently. Relying on weekly digests throughout the quarter means you're never presenting numbers more than seven days old.
What if our AI visibility score dropped this quarter?
Treat it as a diagnostic starting point rather than a failure to hide. Cross-reference the drop against your AI legibility audit and competitor tracking data to see whether a rival gained citations you lost, or whether a technical issue on your site coincided with the decline. Leadership generally responds better to a clear cause-and-fix plan than to a report that avoids the bad number entirely.