Case Study: How One E-commerce Brand Lost Its AI Market Share (And What the Data Revealed)
A real-world case study on how an e-commerce brand quietly lost AI visibility to a competitor—and the data-backed recovery plan that brought its share
How a UK Homeware Retailer Lost 40% of Its AI Market Share Without Warning
Meta description: Discover how a UK homeware retailer lost 40% of its AI shopping citations, what caused its declining AI visibility, and how it recovered share of voice in ChatGPT, Gemini and Perplexity.
A mid-sized UK homeware retailer lost roughly 40% of its AI-generated shopping citations over five months, and not one metric in its traditional analytics stack flagged the decline. Google Search Console looked normal. Google Analytics showed stable sessions. Rankings held steady. Yet the brand was quietly disappearing from ChatGPT, Perplexity and Gemini answers to high-intent questions such as “best non-toxic cookware for families” and “alternatives to [brand]”—queries that had previously surfaced it near the top.
This is a case study in AI market share erosion: what happens when a brand loses share of voice inside AI-generated answers while every conventional dashboard says everything is fine. It examines the data in detail, including where that data comes from and what it can—and cannot—prove. The mechanics matter more than the headline number.
Methodology and disclosure
I work on the data team at MentionOwl, an AI visibility monitoring platform, so I have a commercial interest in this space. The retailer in this case study is a real client that has asked to remain anonymous, and the figures below come from our monitoring of its account. I have not independently verified this pattern against a second vendor’s tooling, so treat this as one detailed, anonymised dataset rather than an industry-wide benchmark.
Where I describe why the competitor’s citations grew, I am describing a correlation observed in this dataset, not a confirmed explanation of how any specific large language model ranks sources. Model providers do not publish that logic, and it almost certainly varies by platform, prompt phrasing, model version and geography.
The monitoring behind these figures used a fixed set of 120 high-intent, UK-relevant prompts. These were based on real customer questions, including “best non-toxic cookware for families UK” and “[retailer] alternatives”. The prompts were run daily across ChatGPT, Claude, Gemini, Copilot and Perplexity over a five-month observation window.
- AI Visibility Score: A 0–100 composite of citation frequency, average citation position and share of voice against named competitors.
- Query coverage: The percentage of the 120 prompts where the brand appeared among the top three cited sources.
- Soft mention: The brand appeared in the answer text without a direct citation, link or clear endorsement.
- AI-referred traffic: An estimate based on referrer patterns and UTM-based heuristics rather than a universally agreed measurement standard. No analytics platform currently offers a fully reliable, cookieless way to isolate sessions originating from AI assistants.
The warning signs nobody noticed
The retailer’s marketing team was not negligent. They were watching the metrics most UK e-commerce teams are trained to monitor. The problem was that these metrics did not capture what happens inside an AI-generated answer.
Ranked roughly by how reliable each signal turned out to be in hindsight:
- AI-referred traffic had dropped 22% quarter over quarter. This was estimated using referrer heuristics and was not part of the standard weekly reporting routine. In hindsight, it was the most reliable leading indicator available because it was measured consistently over time rather than checked once.
- Query coverage in the highest-intent categories fell from 71% to 39%. Across the 120-prompt set, the decline was concentrated almost entirely in “best for [use case]” and “alternatives to” searches—the queries closest to a purchase decision.
- Customer service began receiving more “why isn’t this on your site?” questions. This was a useful qualitative signal, but anecdotal on its own. It was a prompt to investigate the data, not proof of a trend.
- Manual ChatGPT checks showed the brand appearing lower in answers. However, without daily tracking there was no historical baseline. A single spot check shows where a brand stands today, not the trajectory that led there.
- The tone of AI-generated answers shifted subtly. Language moved from descriptions such as “reliable” and “good value for money” towards flatter, more generic phrasing. This was the softest signal and the easiest for a busy team to dismiss as noise.
- Website traffic, conversion rate and Google rankings remained stable. This was the core danger. Losing AI visibility is structurally invisible to the tools most brands rely on because those tools were not designed to measure what happens inside a generated answer.
No single signal would have triggered urgent action at most companies. Together, viewed across five months of consistent monitoring rather than sporadic checks, they described AI market share erosion outside conventional analytics.
The UK homeware category made the retailer especially exposed to this shift. Review sites and buying guides carry substantial weight with both Google and AI assistants, particularly for product searches involving safety, materials, durability and value.
How the competitor gained share of voice in AI answers
What makes this case instructive is that the competitor did not do anything exotic. Over roughly 14 weeks, several changes on its side coincided with a substantial shift in citation share.
The word “coincided” matters. We can show what changed and when, as well as citation data moving in parallel, but we cannot prove which specific factor caused each gain or how much weight any one large language model assigns to a particular signal.
1. Comparison content matched real customer questions
The competitor published structured comparison content framed around questions such as “best non-toxic cookware for families”. This mirrored the phrasing patterns that ChatGPT and Perplexity may reformulate from user intent.
The change preceded a visible increase in query coverage within approximately three weeks.
2. Product pages became easier for AI systems to interpret
The competitor restructured product pages with clearer specifications, FAQs and schema markup. We describe this as stronger AI legibility: the structural quality that plausibly helps a model parse a page and cite it with confidence.
Pages that buried specifications in images or lacked consistent labelling appeared to be skipped in favour of cleaner sources in this dataset, although other contributing factors cannot be ruled out.
3. Third-party reviews and buying-guide mentions increased
The competitor earned fresh reviews and roundup mentions on UK buying-guide sites and review publications that, in our citation-graph analysis, were frequently used as sources by the five monitored platforms.
Owned-content improvements alone did not appear to close the authority gap in this case. Third-party citations moved the needle more, but more slowly, taking most of the 14-week period to compound.
4. Publishing frequency outpaced the retailer’s
The competitor published more frequent and directly relevant content. This correlated with improved citation share and was consistent with the general tendency of retrieval-augmented systems to favour recently updated sources when several options exist.
However, this remains an observed pattern rather than a disclosed ranking rule from any AI provider.
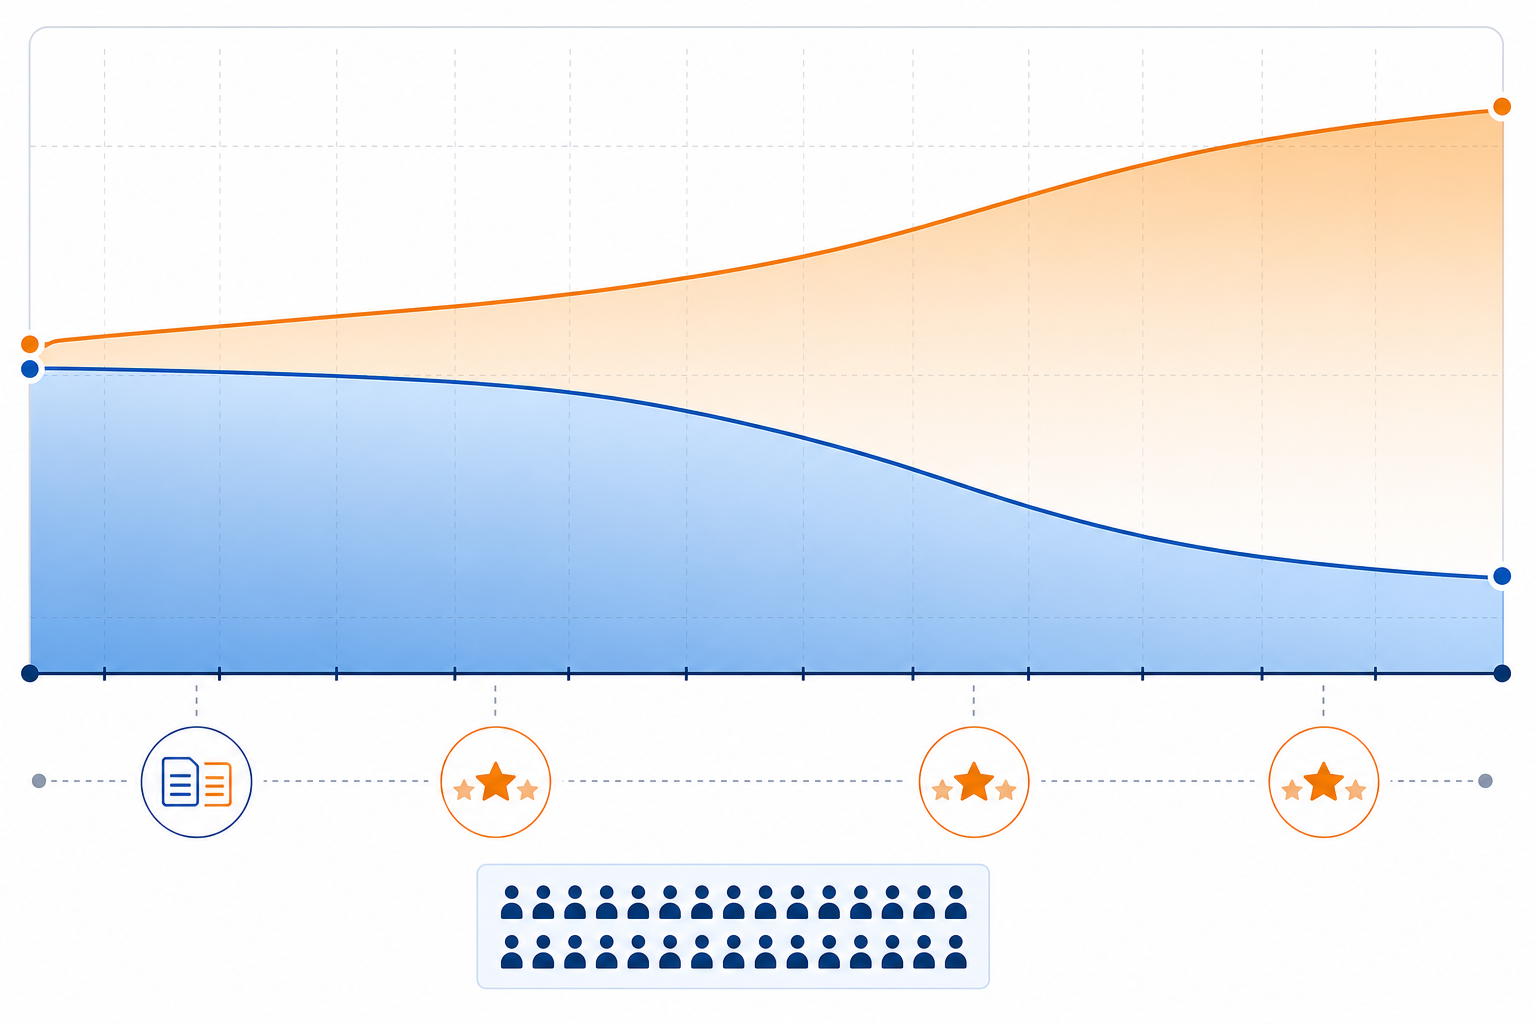
5. Citation share moved to a 3:1 advantage
By week 14, the competitor’s position-weighted citation share had moved from near-parity with the retailer to roughly a 3:1 advantage in head-to-head query categories.
This was a genuine tripling of citation dominance in the categories driving purchase decisions—and the single number in this dataset most worth an operator’s attention.
None of this required a large budget or a dramatic product change. It required consistency, structural clarity and treating AI search as a channel worth monitoring in its own right—related to conventional SEO, but not identical to it.
What the AI visibility data revealed
Once we began running the retailer’s domain and the 120-prompt query set through daily monitoring across ChatGPT, Claude, Gemini, Copilot and Perplexity, the scale of the shift became measurable rather than anecdotal.
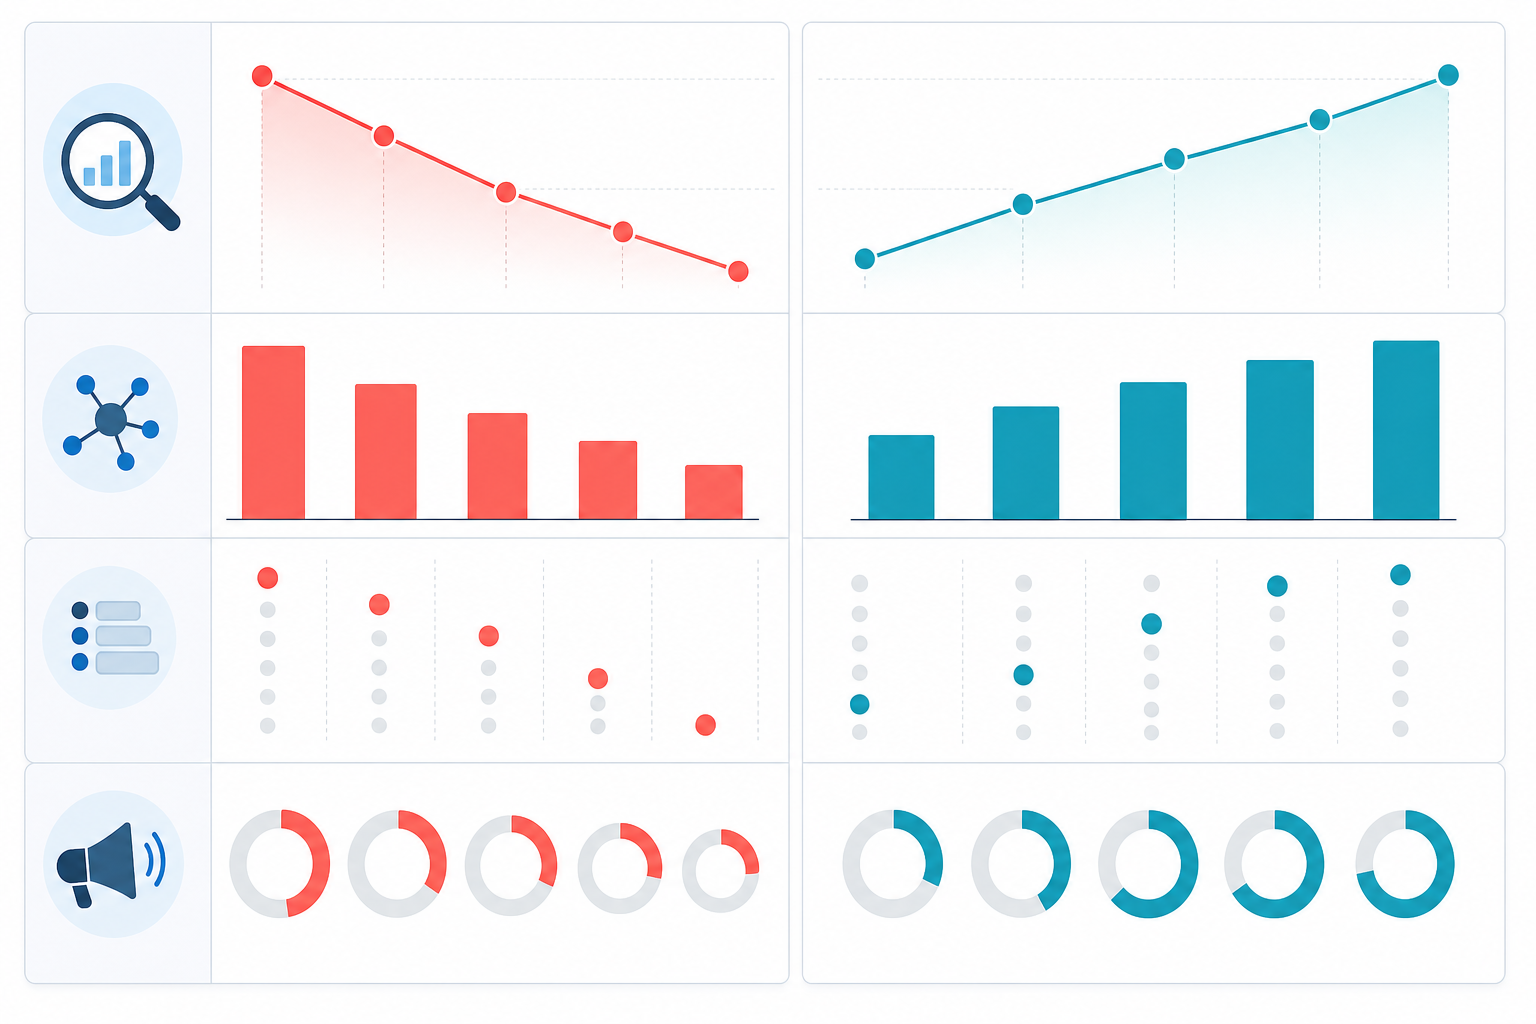
| Metric | Retailer (M1) | Retailer (M5) | Competitor (M1) | Competitor (M5) |
|---|---|---|---|---|
| AI Visibility Score (0–100 composite) | 68 | 41 | 52 | 79 |
| Query coverage (% of 120 prompts, top-three citation) | 71% (85/120) | 39% (47/120) | 58% (70/120) | 74% (89/120) |
| Average citation position when cited | 1.8 | 3.6 | 2.4 | 1.6 |
| Soft mentions (% of citations, no direct link or endorsement) | 9% | 34% | 11% | 13% |
| Perplexity/Gemini recommendation frequency (per 100 monitored prompts) | 22 | 19 | 21 | 41 |
What does the 40% decline represent?
The headline 40% figure refers to total citation instances across all five platforms combined. These fell from approximately 340 tracked citations in month one to roughly 204 in month five across the same 120-prompt set, run daily.
This is different from the AI Visibility Score decline. The score blends citation frequency with citation position and share of voice. Separating these metrics matters because collapsing them into one “AI visibility” number can make the data difficult to interpret and act on.
Several patterns revealed distinct failure modes rather than one uniform collapse.
Query coverage fell sharply and unevenly
The steepest drop was concentrated in “best for [use case]” and “alternatives to [competitor]” phrasing—the queries closest to a purchase decision. Coverage did not decline evenly across every monitored topic.
Citation position worsened even when the brand was mentioned
The retailer’s average position moved from 1.8 to 3.6. This matters because shoppers are generally more likely to act on the top one or two recommendations in an AI answer than on the third or fourth.
That pattern is consistent with research on ranked lists generally, although we do not have UK-specific eye-tracking data for AI answer interfaces to confirm the exact magnitude.
Soft mentions nearly quadrupled
Soft mentions increased from 9% to 34% of citations. This suggests the models still recognised that the brand existed but increasingly treated it as a passing reference rather than a confident, top recommendation.
In other words, the retailer was not disappearing completely. Its authority was eroding within the mentions that remained.
Competitor recommendations nearly doubled
Competitor recommendation frequency in Perplexity and Gemini increased from 21 to 41 per 100 monitored prompts by month four.
That represents a meaningful change in which brand those platforms defaulted to recommending for the category, at least within this query set and observation window.
Steps taken to recover lost AI visibility
Once the retailer had this data, the recovery plan was methodical rather than dramatic. It ran over 10 weeks.
There was no control group, so other factors could have influenced the recovery alongside these interventions. The results represent a strong correlation, not a controlled experiment.
Weeks 1–2: Audit AI legibility
The team ran a full AI legibility audit covering 16 technical checks. The audit looked for reasons LLMs might struggle to parse and confidently cite product pages, including missing structured data, inconsistent specification formatting and FAQ content buried below the fold.
Weeks 2–5: Rewrite product and category content
Key product and category pages were rewritten to answer the specific customer questions appearing in the monitored query set. This closed query coverage gaps identified in the data and focused on exact phrasing patterns rather than generic copywriting.
Weeks 3–8: Build third-party authority
The retailer pursued targeted PR and third-party review placements on UK sites that citation-graph analysis showed were frequently cited sources for the product category.
This addressed an authority gap that owned-content changes alone had not closed.
Week 1 onward: Monitor major AI platforms
Daily LLM monitoring was established across ChatGPT, Claude, Gemini, Copilot and Perplexity. This made it possible to detect future changes in AI market share in near real time rather than discovering them months later through customer service feedback or occasional manual checks.
Ongoing: Track separate visibility metrics
The team tracked sentiment, query coverage, citation position and share of voice weekly against the competitor. This helped confirm that the recovery was genuine rather than inferred from occasional spot checks.
Week 10: Visibility score recovered to 63
By week 10, the AI Visibility Score had climbed from 41 to 63. Query coverage and citation position improved fastest, within three to four weeks of the content rewrite. Sentiment and soft-mention reduction lagged, improving more gradually as third-party citations accumulated.
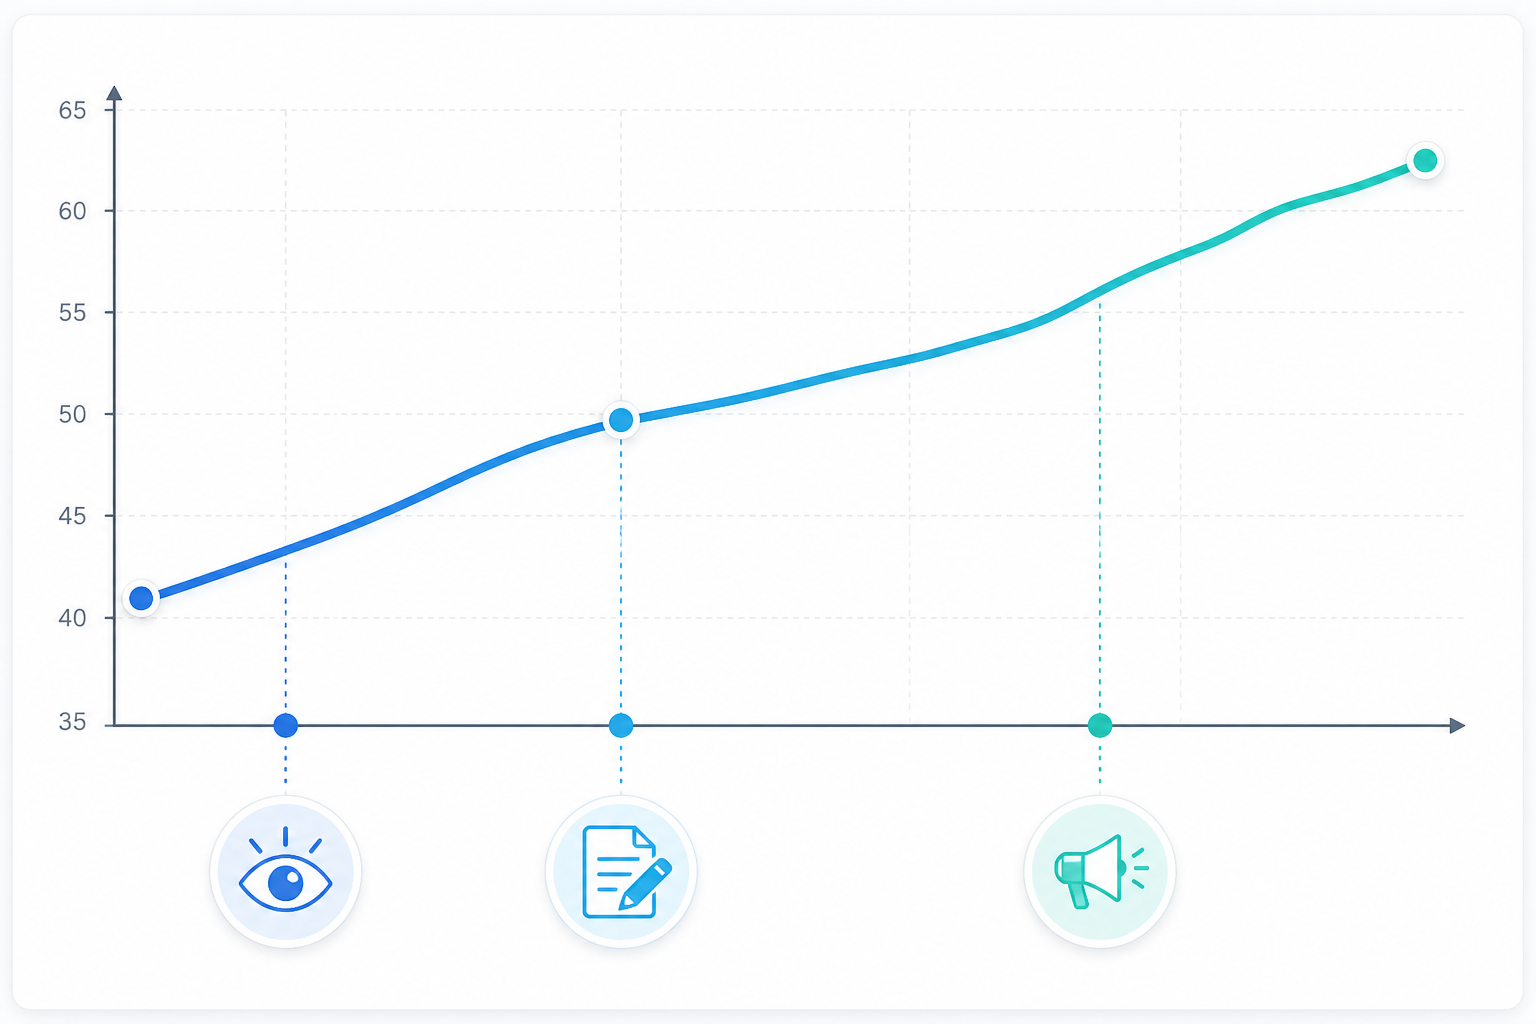
The recovery curve closely mirrored the decline in reverse: technical and content fixes moved query coverage and citation position within a few weeks, while third-party authority signals took longer to compound.
A 30-day starting plan for UK e-commerce brands
Any UK e-commerce team can use the following sequence to assess its exposure to declining AI visibility, whether it uses a monitoring platform or starts manually in a spreadsheet.
Days 1–5: Build an AI search query set
Pull 15–20 real customer questions from Search Console “question” queries, customer service logs and review-site headlines. Aim for a working baseline of at least 50–100 prompts if you want statistically meaningful week-to-week comparisons rather than noisy single-query snapshots.
Include a mixture of:
- “Best for” questions
- Product comparison searches
- “Alternatives to” queries
- Category and product questions
- Safety, quality and value questions relevant to your market
Days 6–10: Establish a baseline
Run each prompt against ChatGPT, Gemini, Perplexity and Copilot, adding Claude if it is relevant to your audience. Log whether your brand is cited, its citation position and whether named competitors appear ahead of it.
A spreadsheet works for a first pass. Daily automated tracking becomes valuable when you need to identify trend changes rather than one-off snapshots.
Days 11–15: Segment your AI visibility metrics
Do not collapse citation frequency, citation position, sentiment and AI-referred traffic into one number. Track them separately because a brand can remain stable on one metric while eroding on another—exactly what happened with soft mentions in this case study.
Days 16–20: Check AI legibility
Review your top 20 product and category pages. Look specifically for:
- Structured data errors or omissions
- Product specifications locked inside images
- Inconsistent product terminology
- FAQ content that is present but poorly labelled
- Important information that is difficult to extract from the page
Days 21–25: Identify influential third-party sources
Identify your three most-cited third-party sources through manual review of AI answers. Then assess whether your PR and outreach activity is actually targeting those publications, review sites and buying guides.
Days 26–30: Set an investigation threshold
Decide in advance what change would trigger a deeper investigation. For example, you might investigate a drop of more than 10 points in visibility score or a fall in query coverage across more than 15% of your prompt set, provided the change continues across two consecutive weekly checks rather than a single day.
A dedicated monitoring tool such as MentionOwl can automate this workflow, but the underlying discipline matters more than the tool: consistent tracking, segmented metrics and a defined threshold for action.
Lessons for other e-commerce brands
This case study highlights five practical lessons about AI market share and share of voice:
- Healthy Google rankings do not guarantee healthy AI visibility. Search engines and AI assistants use related but different systems and sources.
- Citation position matters as much as citation frequency. Being mentioned in fourth place is not equivalent to being the leading recommendation.
- High-intent queries are especially important. Losing visibility for “best for” and “alternatives to” searches can affect purchase consideration before conventional traffic metrics change.
- Third-party authority takes time to build. Content and technical improvements may produce early gains, while reviews and buying-guide mentions can take longer to compound.
- Trend data is more useful than manual spot checks. A fixed prompt set, tracked consistently, shows whether a brand is gaining or losing AI share of voice over time.
Frequently asked questions about AI visibility and market share
How can a brand lose AI visibility without knowing?
AI-generated answers live outside traditional analytics tools, so a brand can drop out of ChatGPT or Perplexity shortlists for months while Google rankings, website traffic and conversion rates appear normal.
The most reliable way to identify the problem early is to track how AI platforms answer a consistent set of relevant customer questions on a recurring basis, rather than relying on occasional manual checks.
What are the earliest warning signs of declining AI mentions?
In this case study, a sustained drop in AI-referred traffic and falling query coverage across a monitored prompt set were the most reliable indicators because they were tracked consistently over time.
A shift towards generic sentiment, fewer first-position citations and rising soft mentions are useful supporting signals. However, any single manual spot check is weak evidence. Look for the same pattern across at least two or three consecutive weekly checks before treating it as a genuine trend.
How do I measure AI share of voice for my online store?
Build a fixed set of real customer questions, ideally 50 or more for greater statistical stability. Run them against the major AI platforms your customers use and track the following separately for your brand and named competitors:
- Whether each brand is cited
- Average citation position
- Whether the mention is a direct citation or passing reference
- How the brand is described
- How often each brand is recommended
Repeat the process consistently—weekly at minimum, or daily if you can automate it—so you are comparing trend lines rather than individual snapshots.
How many prompts do I need for a reliable AI visibility baseline?
There is no universally agreed minimum. In practice, a query set of fewer than 20–30 prompts tends to produce noisy, difficult-to-interpret week-to-week swings.
This case study used 120 prompts across five platforms over five months. For a smaller retailer, 50–100 well-chosen, high-intent prompts tracked consistently will generally provide a more trustworthy signal than a larger set checked sporadically.
How long does it take to recover lost AI visibility?
In this case study, meaningful recovery took about 10 weeks after the retailer addressed technical legibility issues, closed content gaps and secured fresh third-party citations.
There was no control group, so other factors may have contributed. Recovery time will vary by category, competitive pressure and how aggressively competitors are also optimising. Consistent tracking helps confirm whether recovery is occurring rather than assuming it from occasional improvements.
Could this happen to my store even if my SEO looks healthy?
Yes. AI visibility and traditional search visibility are related but not identical measurements.
A brand can rank well on Google while losing share of voice in AI-generated shopping answers, particularly if a competitor is publishing more directly useful, well-structured content or earning more citable third-party coverage in the sources AI platforms tend to draw on.
Conclusion: monitor AI market share before it becomes a revenue problem
This retailer did not suffer a conventional SEO collapse. It lost visibility inside AI-generated shopping answers while its rankings, traffic and conversion data remained stable.
The lesson is not that every change in an AI answer signals a crisis. It is that losing AI visibility can remain invisible unless brands measure it directly. A fixed prompt set, separate share-of-voice metrics and regular monitoring can reveal whether a competitor is steadily taking market share before the decline appears in broader commercial reporting.
For UK e-commerce brands, AI search should be treated as a distinct visibility channel: connected to SEO, but requiring its own baseline, measurements and recovery plan.