Understanding Your AI Visibility Score, Explained: A Marketer's Guide to Reporting AI Search Performance
What actually goes into an AI visibility score, and how do you present it to leadership? I break down query coverage, position-weighted citations, and
What Is an AI Visibility Score? A Complete UK Guide to How It’s Calculated
Quick answer: An AI visibility score is a composite metric — usually shown on a 0–100 scale — that estimates how consistently and favourably your brand appears across generative AI engines such as ChatGPT, Claude, Gemini and Perplexity when real customers ask purchase-related questions. It is not a standardised industry metric. Every vendor, including MentionOwl, calculates it slightly differently, so treat any 0–100 number as that provider’s model of visibility rather than a universally comparable figure.
At MentionOwl, we build our version of the AI visibility score from four weighted inputs:
| Input | What it measures | Illustrative weight |
|---|---|---|
| Query coverage | Percentage of relevant questions where you appear at all | 35% |
| Position-weighted citations | How prominently you’re cited when you do appear | 30% |
| Share of voice | Your citation share versus named competitors | 25% |
| Soft mentions | Descriptive, unlinked references — positive, neutral or critical | 10% |
I want to be upfront: those weights reflect our own methodology at MentionOwl, offered here as an illustrative framework so you can understand the mechanics, not as a formula every tool in this category uses. If a vendor won’t tell you its weights or normalisation method, that’s worth asking about directly before you present its AI visibility score to your leadership team.
Marketing teams often meet this number for the first time in a dashboard. They nod along in the meeting where it’s introduced, then struggle three weeks later when a director asks precisely why the score moved from 54 to 61. This guide exists to close that gap. I’ll walk through each input, show a worked composite calculation, and give you a benchmarking approach you can defend with actual reasoning rather than a vague sense that “it’s gone up.”
![Diagram: A simple layered diagram showing four labeled input blocks - Query Coverage, Position-Weighted Citations, Share of Voice for Understanding Your AI Visibility Score, Explained(https://www.mentionowl.com/blog/share-of-voice-in-the-ai-era-a-new-metric-for-marketers), and Soft Mentions - feeding into a single central gauge labeled 'AI Visibility Score 0-100', clean flat design, blue and grey palette] Caption: The four inputs behind a typical AI visibility score, weighted and combined into one trackable figure. Takeaway: no single input tells the full story — the composite exists to stop a strong result in one area masking weakness in another.
What Goes Into an AI Visibility Score?
Leadership teams want a KPI they can track over time, similar to how they already track Domain Authority or Net Promoter Score, without reading raw AI transcripts every morning. That’s reasonable. A well-built composite score does the aggregation work so people can focus on interpretation and action.
But a composite is only useful if you can take it apart again. Here’s what each input captures, in isolation, before any weighting is applied:
- Query coverage — the breadth of relevant customer questions where you show up at all, expressed as a percentage of a tracked question set
- Position-weighted citations — the prominence of your mention within answers where you do appear, expressed as a decayed score based on where you land
- Share of voice — your citation share relative to named competitors across the same query set, expressed as a percentage
- Soft mentions — descriptive, unlinked references to your brand, scored lower than a direct citation and tagged by sentiment
No single one of these tells the whole story alone. A brand could rank first in one query out of a hundred, producing an eye-catching position score for that single instance, while remaining functionally invisible across the other 99. Another brand might appear across many queries but always as a low-prominence mention several paragraphs deep — high coverage, low actual consideration. The composite exists to stop either partial picture being mistaken for the full one.
It’s worth noting how this differs from the SEO visibility scores UK marketing teams have relied on for the past decade. Traditional SEO visibility tracks where pages rank on Google’s UK results pages — a fixed, rank-ordered list where positions one through ten are the entire game. Generative engine optimisation works differently. There’s no list of ten blue links. An AI model synthesises an answer from training data and, increasingly, live retrieval, and your brand either gets woven into that synthesis or it doesn’t. That’s why AI SEO and AI search strategy need their own measurement framework rather than a repurposed SEO dashboard.
How Is an AI Visibility Score Calculated? A Worked Example
Let’s make this concrete using our illustrative MentionOwl weighting from earlier. Say a mid-sized UK SaaS brand records the following across a 100-question tracked set:
- Query coverage: 40% — appears somewhere in 40 of 100 tracked questions
- Position-weighted citation score: 55 out of 100, explained in the next section
- Share of voice: 33% — one of three named tools in most answers where it appears
- Soft mention score: 60 out of 100
Applying the illustrative weights:
Score = (0.35 × 40) + (0.30 × 55) + (0.25 × 33) + (0.10 × 60)Score = 14 + 16.5 + 8.25 + 6 = 44.75, rounded to 45
Now imagine that brand publishes three new comparison pages, fixes structured data on its pricing page and picks up two additional named mentions the following month. Coverage rises to 46%, position score to 62, share of voice to 38%, while soft mentions stay flat at 60:
Score = (0.35 × 46) + (0.30 × 62) + (0.25 × 38) + (0.10 × 60) = 16.1 + 18.6 + 9.5 + 6 = 50.2
That’s a five-point movement you can trace to two specific inputs — position and share of voice — rather than a vague “the number went up.” This is the level of detail I’d expect any AI visibility vendor to be able to show you on request.
Query Coverage Explained
Query coverage is the percentage of realistic customer questions in which your brand shows up anywhere within the AI’s answer — a direct citation, a named recommendation or a brief descriptive mention. It’s the foundation layer. If you’re not appearing at all, position and sentiment become irrelevant, because there’s nothing there to position or feel sentiment about.
At MentionOwl, we generate this question set by modelling the purchase-decision queries a real prospect would plausibly ask ChatGPT or Perplexity. For a project management software company, that might include “best project management tool for small agencies”, “alternatives to Asana for freelancers” or “which project management software integrates with Slack?” We run this set daily against the major AI platforms and record how each one answers.
A brand appearing somewhere in the answer for 40 out of 100 tracked questions has a query coverage rate of 40%. That figure then feeds into the overall AI visibility score with its own weighting, sitting alongside the other three components rather than standing alone. A brand with 40% coverage but consistently strong positioning within that 40% can easily outscore a brand with 70% coverage where every mention is a throwaway line in paragraph four.
When coverage comes back lower than expected, a few things are usually worth checking — though I’d be careful not to overstate any single cause:
- Thin content on comparison and decision-stage questions. If your site never addresses “X vs Y” or “best for [use case]” phrasing, there’s simply less material for a model to draw on when it’s trained or when it retrieves live sources.
- Weak FAQ-style content. FAQ pages tend to help when they genuinely answer the questions customers ask, not because AI systems inherently privilege the FAQ format. A well-written comparison guide can outperform a thin FAQ page.
- Structured data and clean semantic markup. This is worth qualifying carefully: structured data and clear page structure may improve how machines interpret and retrieve your content in some systems, but they do not guarantee inclusion or citation by ChatGPT, Claude, Gemini or Perplexity. Model training data, live retrieval mechanisms and answer generation are separate stages, and a technically clean page can still go uncited for reasons unrelated to markup.
That third point is why we run AI legibility audits at MentionOwl — a set of technical checks that flag where a site may be harder for AI crawlers to parse. I’d treat the results as a diagnostic worth investigating, not a guarantee that fixing them will move your coverage number by any specific amount.
What Are Position-Weighted Citations?
Appearing somewhere in an AI answer is necessary but not sufficient. Being named as the primary recommendation, or cited in the first sentence, is worth substantially more than being listed sixth in a rundown of seven options most users won’t read in full.
Before going further, it’s worth being precise about what “position” actually means here, because generative answers don’t have a fixed slot structure the way a Google results page does. At MentionOwl, we define position using a combination of signals:
- Citation order — the sequence in which brands are named within the answer text
- Recommendation language — whether a brand is framed as “the best option”, “a solid choice” or simply listed among alternatives
- Paragraph position — whether the mention appears in the opening lines or is buried several paragraphs down
We apply a decaying weight to each position. An illustrative version of that curve looks like this:
| Position | Illustrative weight |
|---|---|
| 1st named / primary recommendation | 1.0 |
| 2nd named | 0.7 |
| 3rd named | 0.45 |
| 4th named | 0.25 |
| 5th named or lower | 0.1 |
Worth flagging: this curve is our own approach, not an industry standard, and different AI engines structure answers differently enough that a “3rd position” in a short Perplexity answer isn’t necessarily equivalent to a “3rd position” in a longer ChatGPT response. We normalise for answer length where possible, but I’d encourage some scepticism toward any vendor that presents position weighting as a perfectly clean, universally consistent measurement.
This logic mirrors something UK marketing teams already understand from traditional search: click-through-rate curves. The top organic result on a Google results page has historically captured roughly a quarter to a third of all clicks, with each subsequent position falling off sharply. Generative AI answers seem to behave similarly, arguably more starkly, because there’s no scrollable list for a user to work through. Two brands can post identical 45% coverage figures and land at very different overall scores, because one is the consistently named first recommendation and the other is perpetually fourth or fifth in a crowded list.
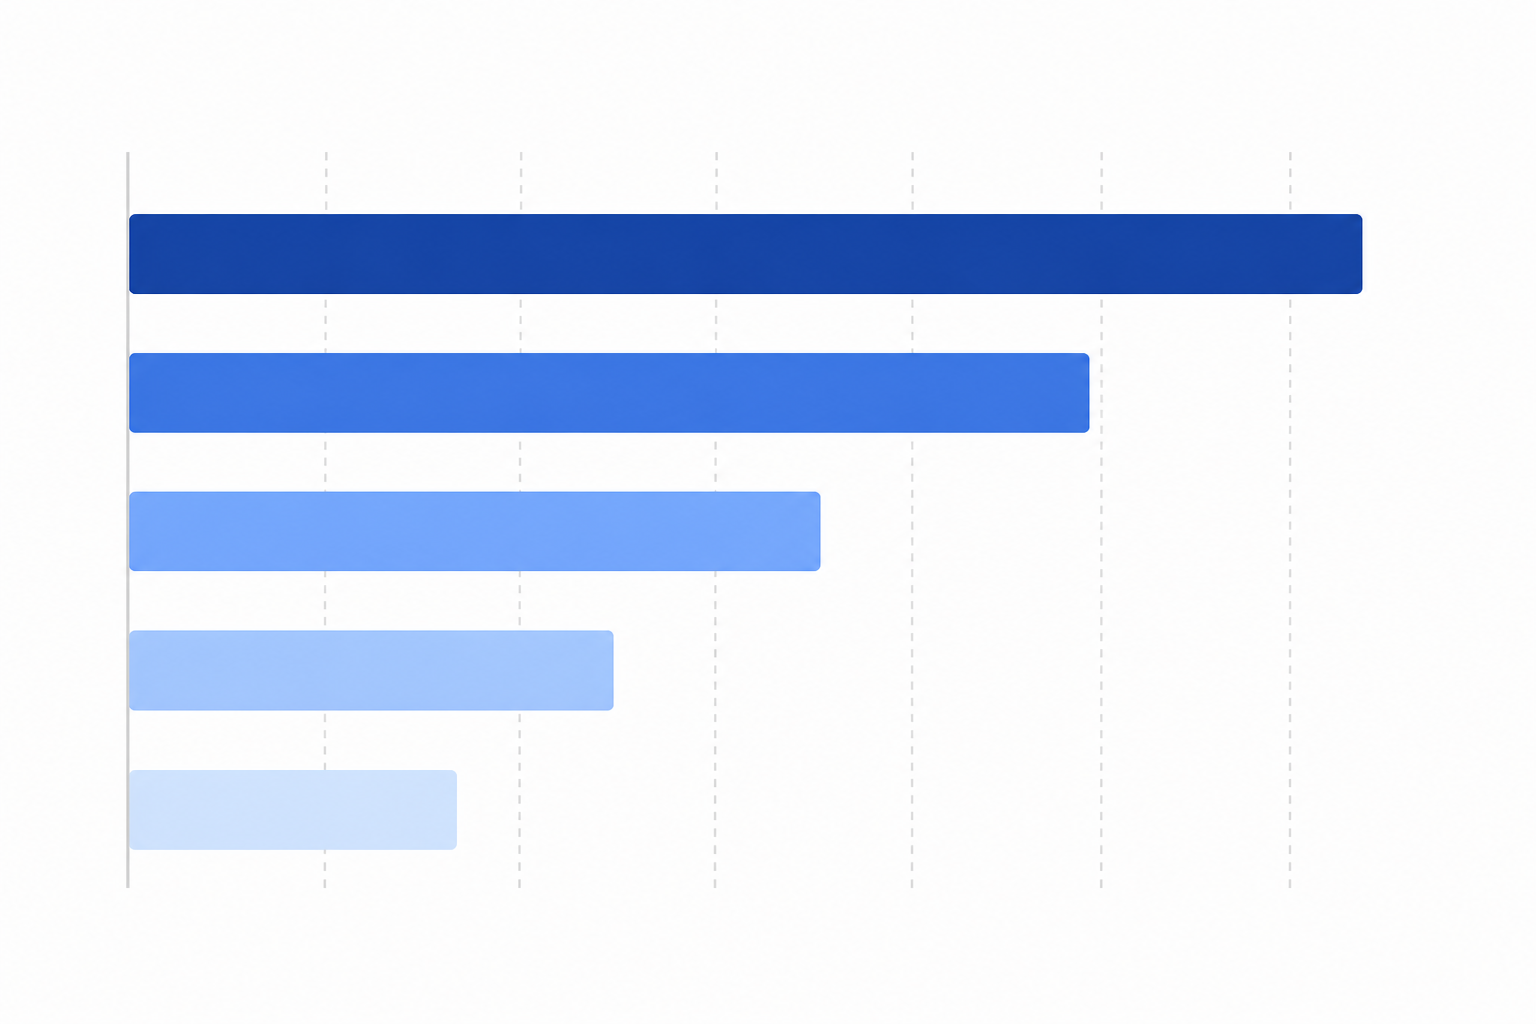 Caption: Illustrative position-decay curve used to weight citations. Takeaway: a first-named mention typically carries several times the value of a fifth-named mention, which is why coverage alone can be misleading.
Share of Voice vs Soft Mentions: What’s the Difference?
These two components often get conflated, but they measure different things and deserve to be reported separately to leadership.
Share of voice is your citation share relative to named competitors within the same query set. We calculate it at the query level first, then aggregate. Take three queries as an example:
- Query 1: three tools named, you’re one of them → 33% for this query
- Query 2: two tools named, you’re not one of them → 0% for this query
- Query 3: four tools named, you’re named first → counted as a citation win, roughly 25% raw share before position weighting is layered on
Averaged across those three queries, your raw share of voice sits around 19%, before any position weighting is applied to reflect that you were named first in Query 3. This query-level aggregation matters, because a brand that wins big in a handful of high-value queries can post a respectable share of voice even with patchy coverage elsewhere.
Soft mentions capture instances where your brand is referenced descriptively or implicitly, without a direct citation, link or explicit recommendation. To be precise about something the introduction glossed over: soft mentions aren’t automatically positive. They carry contextual signal that can read as positive, neutral or mildly critical, and a properly built score should tag sentiment separately rather than assuming every unlinked reference is a good one. A neutral factual mention (“tools in this space include X, Y and Z”) is treated differently from a mildly critical aside, even though both are technically “soft.”
| Dimension | Share of Voice | Soft Mentions |
|---|---|---|
| What it measures | Citation share versus named competitors | Descriptive or implicit brand references |
| Format | Direct, attributable citation or recommendation | Unlinked, contextual mention |
| Sentiment handling | Assumed neutral-to-positive because it’s a named recommendation | Tagged positive, neutral or negative separately |
| Weighting in score | Higher — 25% in our illustrative model | Lower — 10% in our illustrative model |
| Leadership relevance | Closest AI-era equivalent to market share | Secondary trend indicator |
I’d argue share of voice is the single figure leadership should care about most, because it’s the closest AI-era equivalent to market share and it’s directly comparable across your competitor set in a way raw coverage percentages aren’t. Two brands in different niches can both claim 60% query coverage while facing entirely different competitive intensity; share of voice normalises for that by measuring you against the rivals actually being named in the same answers.
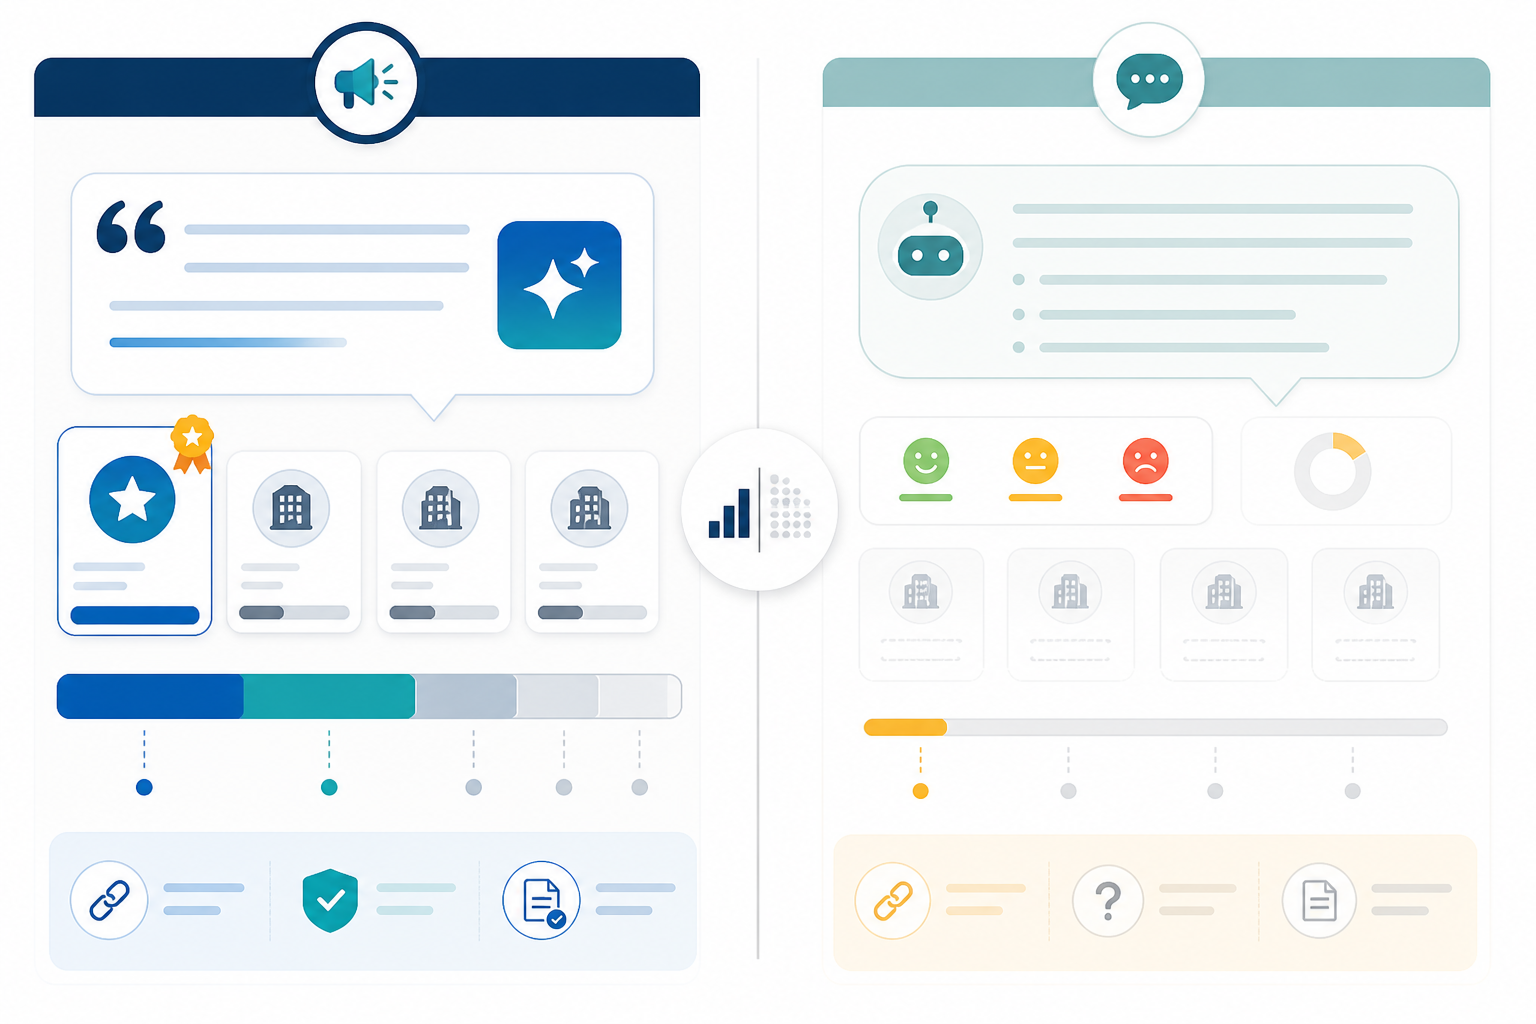 Caption: How share of voice and soft mentions differ in format and weighting. Takeaway: share of voice reflects active recommendations; soft mentions reflect passive brand awareness that still needs sentiment context.
How to Benchmark an AI Visibility Score Over Time
A visibility score reported once, in isolation, tells leadership almost nothing. The value comes from tracking the trend with enough methodological discipline that you can defend movements when someone asks why the number changed.
- Establish a baseline over a full week, not a single day’s snapshot. AI engines vary their answers day to day for the same query, sometimes substantially, so a one-day reading is closer to noise than signal.
- Track the score weekly. Daily fluctuations more often reflect model variance than genuine shifts in underlying visibility.
- Segment tracking by AI engine. ChatGPT, Gemini, Perplexity and Copilot draw on different retrieval mechanisms and training data. In our tracking at MentionOwl, we’ve seen the same brand score noticeably differently across engines on an identical query set — sometimes by a meaningful margin — though the exact gap varies enough by category that I wouldn’t quote a single figure as typical.
- Correlate score movements with specific actions, such as publishing new FAQ content, fixing structured data gaps or launching a comparison page targeting a previously uncovered query. This turns reporting from “the number went up” into a before-and-after narrative leadership can act on.
- Benchmark against your own cohort, not a universal target. Rather than chasing a fixed number like 100 or assuming a generic “good” range applies to your category, compare your score against the same competitor set, the same query list and the same engines over time. What counts as strong varies by category competitiveness, brand age and how many competitors are being named in the first place.
Before you trust any benchmark number — from us or anyone else — I’d ask a vendor to confirm:
- What’s the sample size and date range behind any “typical” score range they quote?
- Which engines and model versions were included?
- Is the competitor set fixed or does it change over time?
- How is sentiment on soft mentions actually being classified?
- Are weights and normalisation methods documented anywhere you can review?
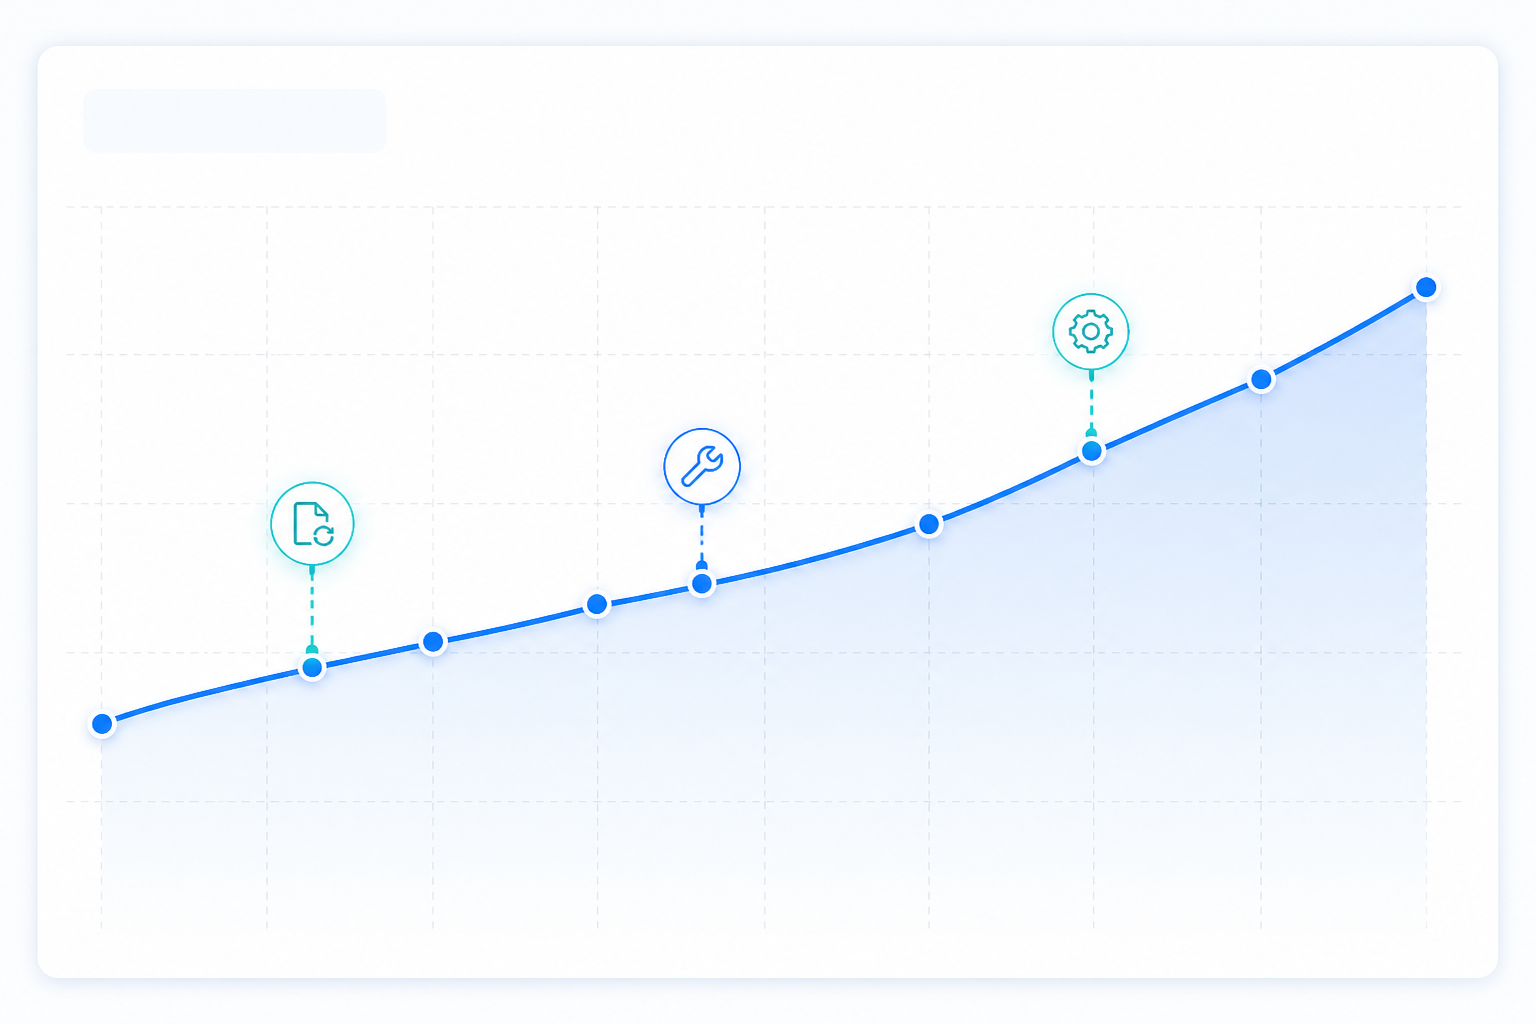 Caption: An eight-week trend line with content and technical changes annotated at the point they were made. Takeaway: pairing score movement with a dated list of specific actions is what makes a trend defensible in a leadership meeting.
Frequently Asked Questions About AI Visibility Scores
What Is a Good AI Visibility Score?
There’s no universal benchmark, because an AI visibility score isn’t a standardised metric across vendors. Rather than anchoring to a fixed range, benchmark against your own category cohort: the same competitor set, the same query list and the same engines, tracked over the same period. In our own tracking at MentionOwl, established brands with strong content coverage and clean technical foundations tend to cluster in the upper half of the scale, while brands with real AI legibility gaps or very new market presence tend to sit lower — but I’d treat any specific numeric range you’re quoted, including ours, as a starting point for questions rather than a settled fact.
How Is an AI Visibility Score Calculated?
At MentionOwl, we calculate it as a weighted composite: query coverage (35%), position-weighted citations (30%), share of voice (25%) and soft mentions (10%) in our illustrative model, each normalised to a 0–100 scale before weighting. Each component is measured across ChatGPT, Claude, Gemini, Copilot and Perplexity and rolled into a single figure. This is our methodology specifically — other vendors may weight or define these inputs differently, so ask any tool you’re evaluating to show its formula, not just its final number.
How Often Should an AI Visibility Score Be Checked?
Weekly for reporting purposes, since day-to-day AI answer variance can create noise that doesn’t reflect a genuine shift in visibility. Daily crawls feeding into a weekly digest tend to give a more stable trend line than a jumpy daily number.
How Do I Explain an AI Visibility Score to Leadership?
Frame it as the AI-era equivalent of market share and search visibility combined: it estimates what percentage of relevant customer questions your brand wins, how prominently you’re recommended versus named competitors and whether that trend is improving month over month. Pair the score with a before-and-after chart tied to specific content or technical changes, and be upfront that it’s one vendor’s model of visibility rather than an audited industry standard — that honesty tends to land better than presenting the number as gospel.