How Agencies Can White-Label AI Visibility Reporting: A Practical Guide
A guide for UK agencies on white-labelling AI visibility reporting: which metrics to include, how to explain scores to clients, how to automate monthl

White-Label AI Visibility Reporting for UK Agencies: How to Build Client Reports That Get Read
To white-label AI visibility reporting well, pair a reliable monitoring source with a small set of client-friendly metrics: a single visibility score, share of voice against named competitors, citation sources and sentiment. Then present them in a branded, narrative-led report delivered on a regular schedule. I recommend leading with what changed and what you are doing about it, not with raw data. A report that explains the story behind the numbers gives clients a firmer basis for strategy conversations, including conversations about renewal and scope. 📊
The rest of this guide covers what clients expect, which metrics to include, how to explain them, how to design and automate the report, and how to tie it to retention and upsell conversations. I work with this data daily at MentionOwl, so I have separated general guidance, which applies to any monitoring source, from product-specific details, which are labelled as such. A short disclosure at the end explains how to evaluate vendors, including us.
What Clients Expect From AI Visibility Reporting Today
Clients are asking about AI search because buyers increasingly use tools such as ChatGPT, Perplexity, Gemini and Copilot for research, and marketing directors are being asked by their boards how the brand appears there. Gartner forecast in February 2024 that traditional search engine volume would fall 25% by 2026 as users shift to AI chatbots and virtual agents. That is a forecast, not a measured outcome, but it explains why the question has reached the boardroom.
The behavioural evidence is more cautious, and it is worth stating precisely. Pew Research Center analysed browsing data from 900 US adults in March 2025 and found that users clicked a traditional result on 8% of visits to Google pages with an AI summary, against 15% of visits without one. They clicked a link inside the summary on about 1% of visits. Adobe Analytics reported that generative AI referrals to US retail sites rose 1,200% between July 2024 and February 2025, from a low base.
A note on UK evidence: both datasets describe US users and US retail sites. I am not aware of a comparably robust, publicly available UK series on AI search behaviour that I could cite with confidence, so I would not use these figures as a proxy for British consumers. In client material, label them as US data. For UK relevance, rely on what you can measure directly: prompt sets written in British English, tested from a UK location, using UK competitors and UK buying journeys. Ofcom's Online Nation reports are a sensible place to check for emerging UK usage data, but verify any figure against the original publication before quoting it.
The AI visibility reporting expectation gap
Clients understand rankings and traffic dashboards, but they have no mental model for AI visibility, so they look to the agency to define what good looks like. Underneath, they are asking three things:
- Are we being mentioned?
- Are we recommended over competitors?
- Is what AI says about us accurate and positive?
A one-off screenshot of a ChatGPT answer answers none of those. Responses vary by run, platform, phrasing, location and model version, so credible reporting needs repeated sampling and trend lines. A good report states its prompt set, market, platforms and collection dates, and presents results as a defined sample, not a census of every AI answer. It should also separate mentions from citations. A mention does not show that a user can verify or visit the source, whereas a citation links to one.
There is one more measurement caveat that applies to every report. Google's documentation on AI features in Search states that AI Overviews traffic is counted within Search Console's overall Web search data and not reported separately, so Search Console totals cannot stand in for AI visibility. Dedicated brand monitoring fills that gap.
Why brand monitoring is the foundation of AI visibility
AI visibility reporting is brand monitoring. It tracks how, where and in what terms a brand is represented; the channel is simply generative AI answers instead of news, social or review sites. That framing helps, because clients already understand why brand monitoring matters. The same discipline applies: a fixed scope, a consistent method, a record of the evidence, and a human who interprets what changed.
What to Include in a White-Label AI Visibility Report
I recommend nine components, ordered by how a client reads rather than how the data is collected:
- Executive summary: three or four sentences on movement in visibility, headline wins and priority risks.
- Overall visibility score (0-100), with month-on-month change and a short explanation of how it is built (a worked example follows below).
- Share of voice against named competitors, broken down by platform, for example ChatGPT, Claude, Gemini, Copilot and Perplexity.
- Citation analysis: which client pages and which third-party sources AI engines cite.
- Sentiment analysis: how the brand is described, with example quotes lifted from real AI answers.
- Query-level results: the customer questions tested, where the brand appears and where competitors win.
- Technical readiness findings: whether AI crawlers can access and understand the client's pages, translated into plain-English fixes. (MentionOwl's version is a 16-check AI legibility audit; other tools will use different checks.)
- AI referral traffic: visits from AI platforms, drawn from your analytics. Keep these separate from visibility metrics, because visits and conversions come from analytics data, not prompt sampling. Measurement depends on your analytics setup and on whether the AI platform passes a usable referrer, so some AI-driven visits will be misattributed as direct traffic. Say so in the report.
- Recommended actions for the next 30 days, tied to the services you actually sell.
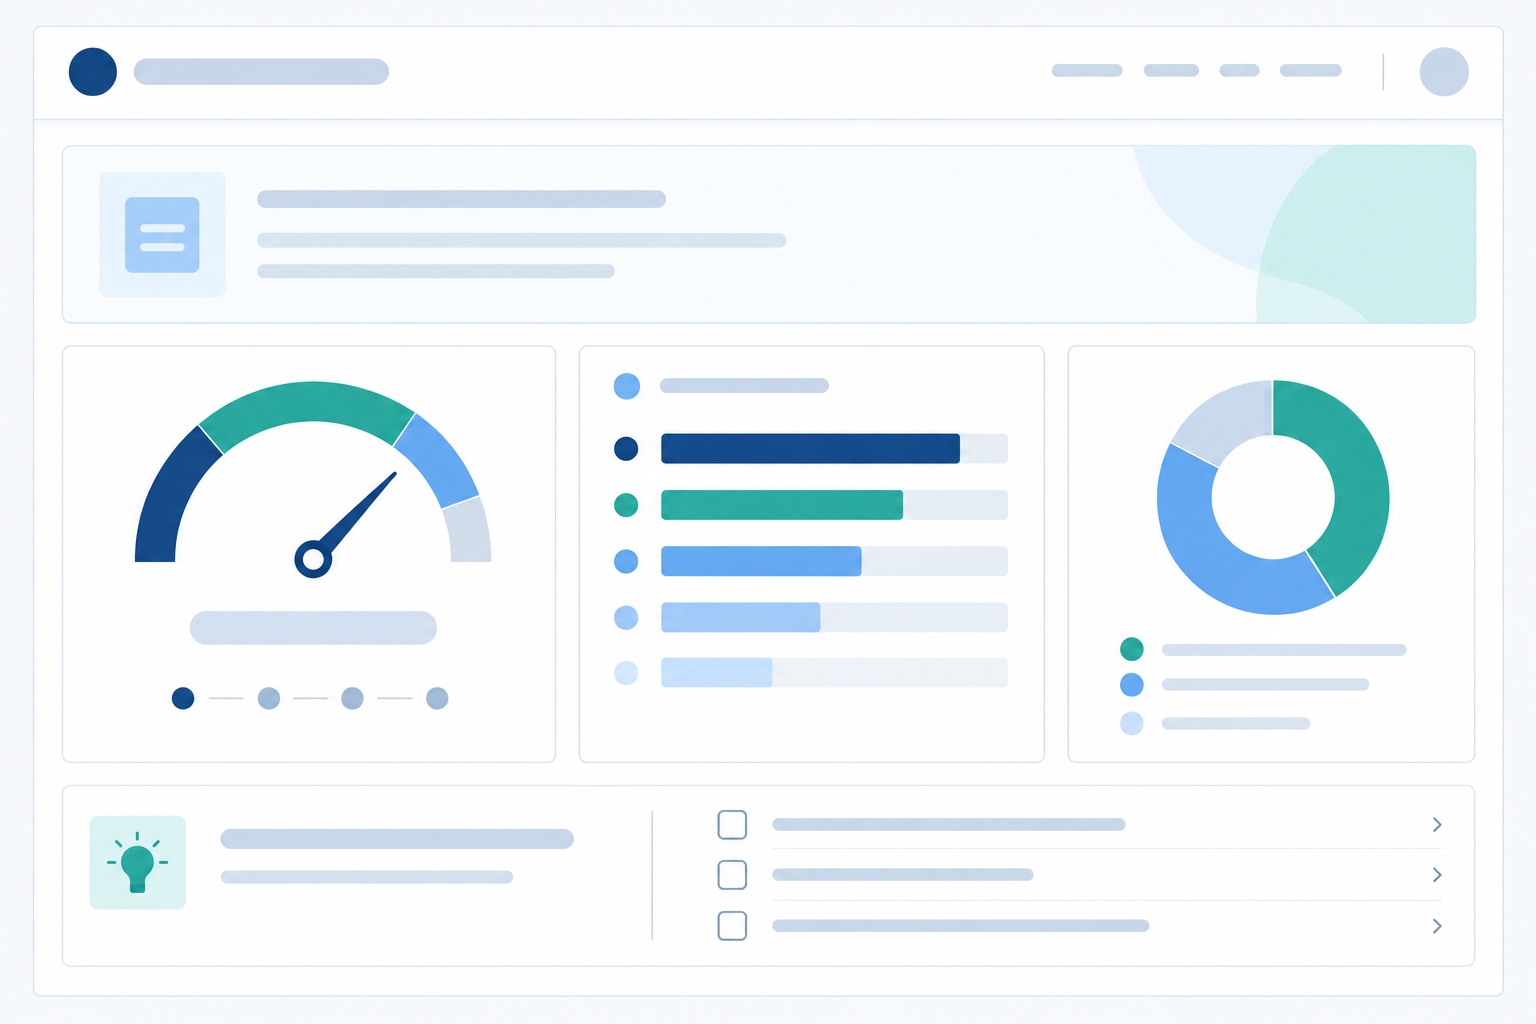
One design choice improves accuracy considerably: report brand-led prompts (where the client is named) separately from non-branded category prompts (where competitors may appear instead). The first shows existing recognition. The second shows whether the brand wins recommendations from buyers who have not yet heard of it.
A sample AI visibility finding, followed through
The following is a hypothetical excerpt, included to show the shape of a useful finding and not a real client result:
- Finding: In 18 of 25 non-branded 'best [category] for UK small businesses' prompts, AI answers named two competitors and not the client. Both competitors were cited alongside the same two review sites.
- Interpretation: The gap sits in third-party coverage, not on the client's own site.
- Action (next 30 days): Pitch for inclusion on those two review sites and update the client's comparison page.
- How we will judge it: Re-run the same prompt set at the next report and compare. A change in score alone would not prove business impact.
Choosing AI Visibility Metrics That Resonate With Non-Technical Clients
The most common failure I see is metric overload. Limit the headline view to four or five numbers and keep everything else in an appendix. AMEC's Barcelona Principles 3.0 emphasise setting measurable objectives and transparent evaluation. A useful way to apply that is to translate each technical measure into a question a finance director would ask, while keeping each translation within what the data can support.
| Technical metric | Client-friendly translation | The so-what sentence |
|---|---|---|
| Query coverage | In how many of the tracked customer questions the brand is mentioned | 'We appeared in 34 of the 60 questions in this month's tracked prompt set.' |
| Position-weighted citations | How prominently AI recommends you | 'Being named first carries more weight than being the fifth option listed.' |
| Share of voice | Of the brand mentions in the tracked sample, how many are yours | 'In our tracked sample we take three of every ten mentions; the market leader takes five.' |
| Soft mentions | Being named without a link | 'Buyers may still see your name, even when no click follows.' |
| Sentiment | Whether the description is accurate and favourable | 'AI calls us reliable but dated, which is a messaging problem we can fix.' |
A caution on the first row: 34 of 60 is a rate across a monitoring prompt set, not the proportion of shoppers who encounter the brand. Tracked prompts are a measurement instrument, not a representative sample of consumer behaviour, so never convert coverage into a statement about how many people see you.
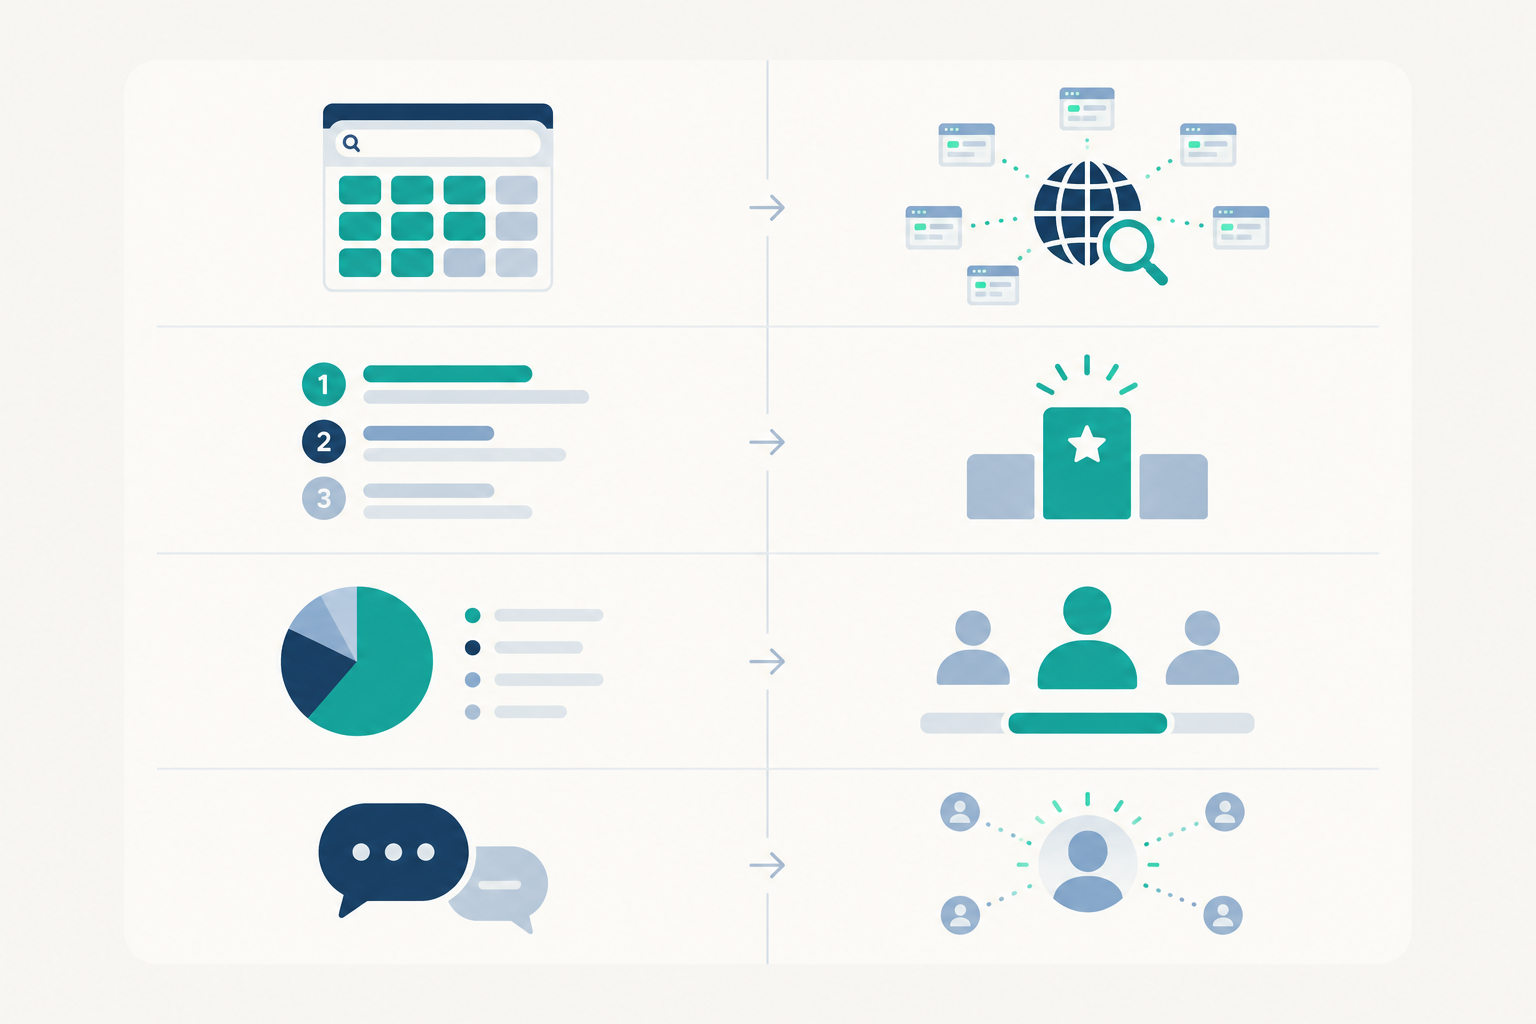
Explaining visibility scores, share of voice and volatility
For the visibility score, a credit-score or league-table analogy works: one number, clear bands and a trend arrow. Bands such as 0-30 low, 31-60 developing and 61-100 strong are an agency convention you define, not an industry standard, so say so.
A score is only defensible if you can show how it is built. MentionOwl's score draws on query coverage, position-weighted citations, share of voice and soft mentions. We do not publish the weighting in this article, and the figures below are illustrative weights, not our actual formula. They show the kind of worked example you should be able to get from any vendor.
| Component (scaled 0-100) | Illustrative value | Illustrative weight | Contribution |
|---|---|---|---|
| Query coverage (34 of 60 prompts) | 56.7 | 40% | 22.7 |
| Position-weighted citations | 40 | 25% | 10.0 |
| Share of voice | 30 | 25% | 7.5 |
| Soft mentions | 45 | 10% | 4.5 |
| Visibility score | 44.7, reported as 45 |
If coverage rose to 40 of 60 prompts (66.7) with everything else unchanged, the score would rise by four points to about 48.7, because ten points of coverage multiplied by a 40% weight is four. That is the sort of sentence that lets an account manager answer 'why did it move?' with evidence. Two further rules protect month-on-month comparisons. First, if a platform fails to return results for a run, exclude those observations from both numerator and denominator and flag it, rather than scoring them as zero. Second, if you change the prompt set, platforms or weighting, annotate the report and, where possible, restate the prior month on the new basis so the trend is like-for-like. If a vendor's formula is fully proprietary, tell clients that limitation exists. Don't imply the inputs alone make the score transparent.
For share of voice, define it before you report it. There is no universal AI-search formula, so disclose the prompt set, denominator and weighting. The figure describes your tracked sample, not the brand's share of the whole AI market, and it differs from traditional SEO share of voice, which relies on rankings and estimated clicks.
On volatility, AI answers fluctuate, so report trends across weeks rather than single-day movements. As a working rule of thumb, which you should calibrate against each client's own history, treat a three-point wobble as probable noise and a sustained ten-point drop as a signal worth investigating. I find it helps to group metrics in three layers: presence (mention rate, share of voice), credibility (citations, cited pages, accuracy) and impact (qualified referral visits, where attribution allows).
Designing White-Label AI Visibility Reports Clients Actually Read
Apply an inverted pyramid: conclusion and recommendation first, key metrics and trends second, query-level detail in an appendix. Clients who read only the first page should still know what happened and what you are doing about it.
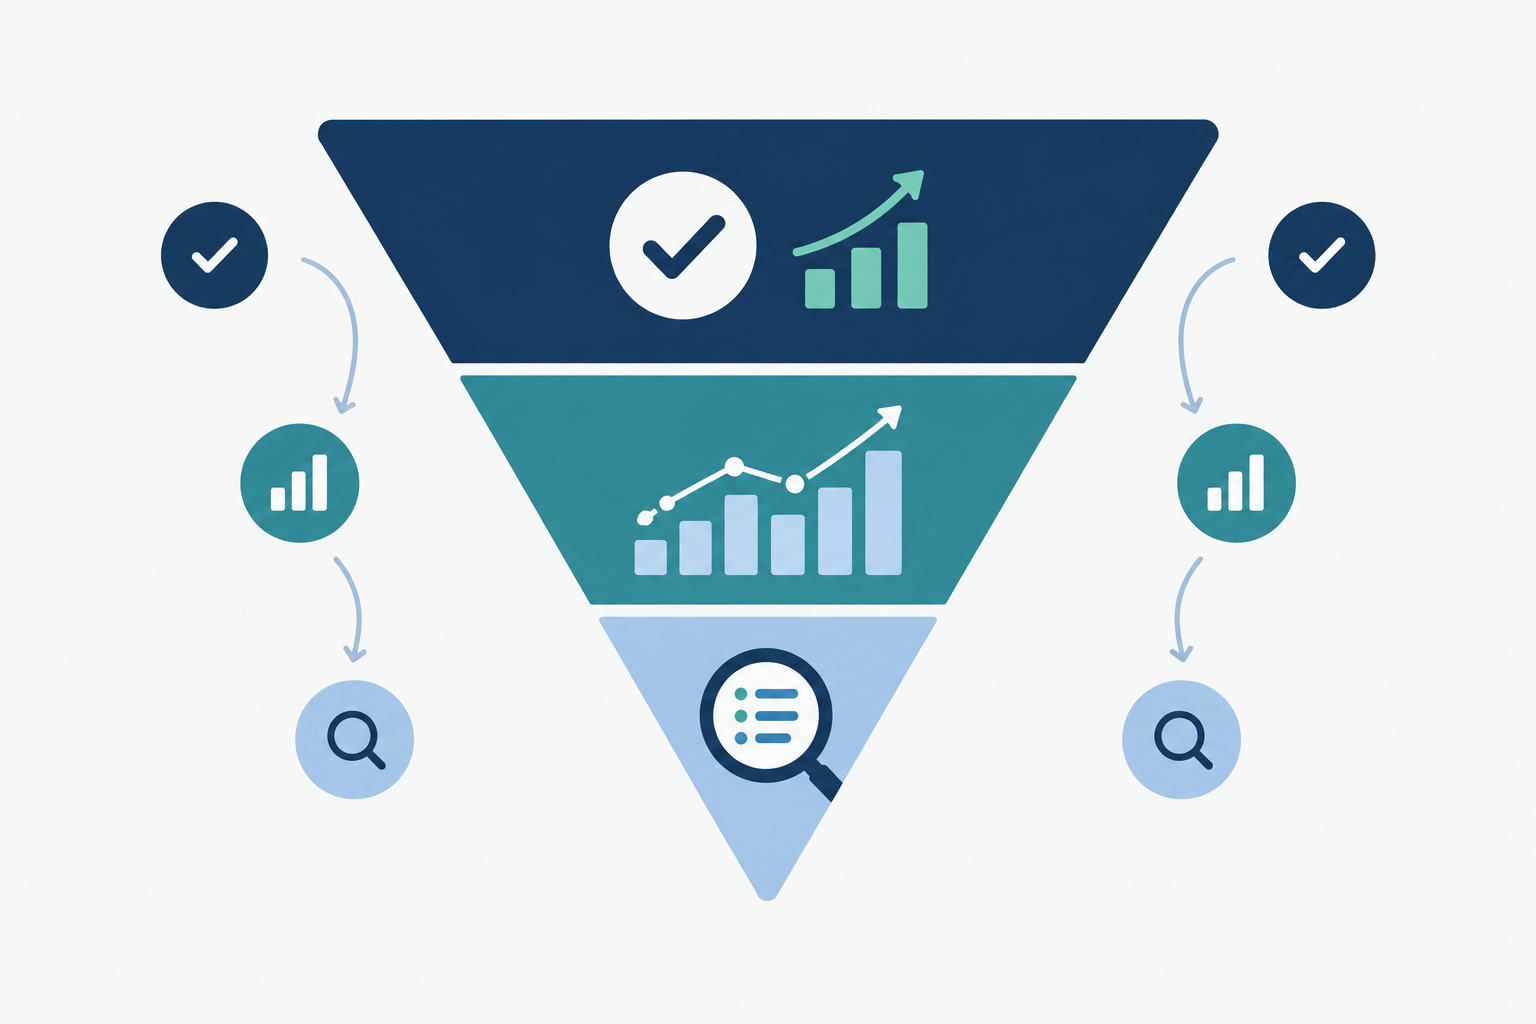
A few principles hold up well in practice:
- Brand it fully. That means the agency logo, colour palette, and a custom domain or email sender, with no third-party branding anywhere the client will see.
- Prefer visuals to tables. Trend lines suit the visibility score, stacked bars suit share of voice, and heatmaps show platform-by-query coverage.
- Quote real AI answers. A verbatim excerpt where ChatGPT recommends a competitor persuades more than any percentage.
- Stay short. Two to four pages for the main report, with a longer appendix for those who want it.
- Add a 'what this means for you' note to each section, written in the account manager's voice.
- Consider two versions: a one-page view for leadership and a fuller one for the marketing team.
Finally, include a short methodology note covering prompts tested, platforms, market, language, collection period and any changes since last month. It costs a few lines and protects you when a client tries the same question in ChatGPT and gets a different answer. For UK clients, specify that prompts were written in British English and run for a UK location.
Automating Monthly AI Visibility Report Delivery
The aim is to automate collection and delivery while keeping a human on interpretation. The workflow below is general. Steps that depend on MentionOwl features are marked [MentionOwl] so you can map them to whichever platform you use. Check the relevant product documentation for current capabilities before building a process around them.
- Set up each client's domain and question set. [MentionOwl] crawls the site and auto-generates relevant customer questions. With any tool, review and refine the set so it reflects how the client's buyers actually ask.
- Add the competitors to track. Named competitor tracking is what makes share of voice calculable.
- Build a baseline. Let regular runs accumulate, ideally for four weeks before the first formal report, so your first month-on-month comparison means something.
- Use weekly digests as early warnings. Account managers can flag a sudden drop internally before it surprises anyone in the monthly report.
- Pull data through an API or export into your own reporting stack, such as a BI dashboard, Looker Studio or a client portal. [MentionOwl] offers a REST API for this. Your branding gets applied here, because the report template is yours.
- Optionally, draft commentary with AI assistance. [MentionOwl] provides an MCP server so AI agents can query the data. Whichever route you use, a human should review every draft before it is sent.
- Schedule monthly delivery and build a review checklist covering anomalies, methodology changes and any conclusion that could mislead.
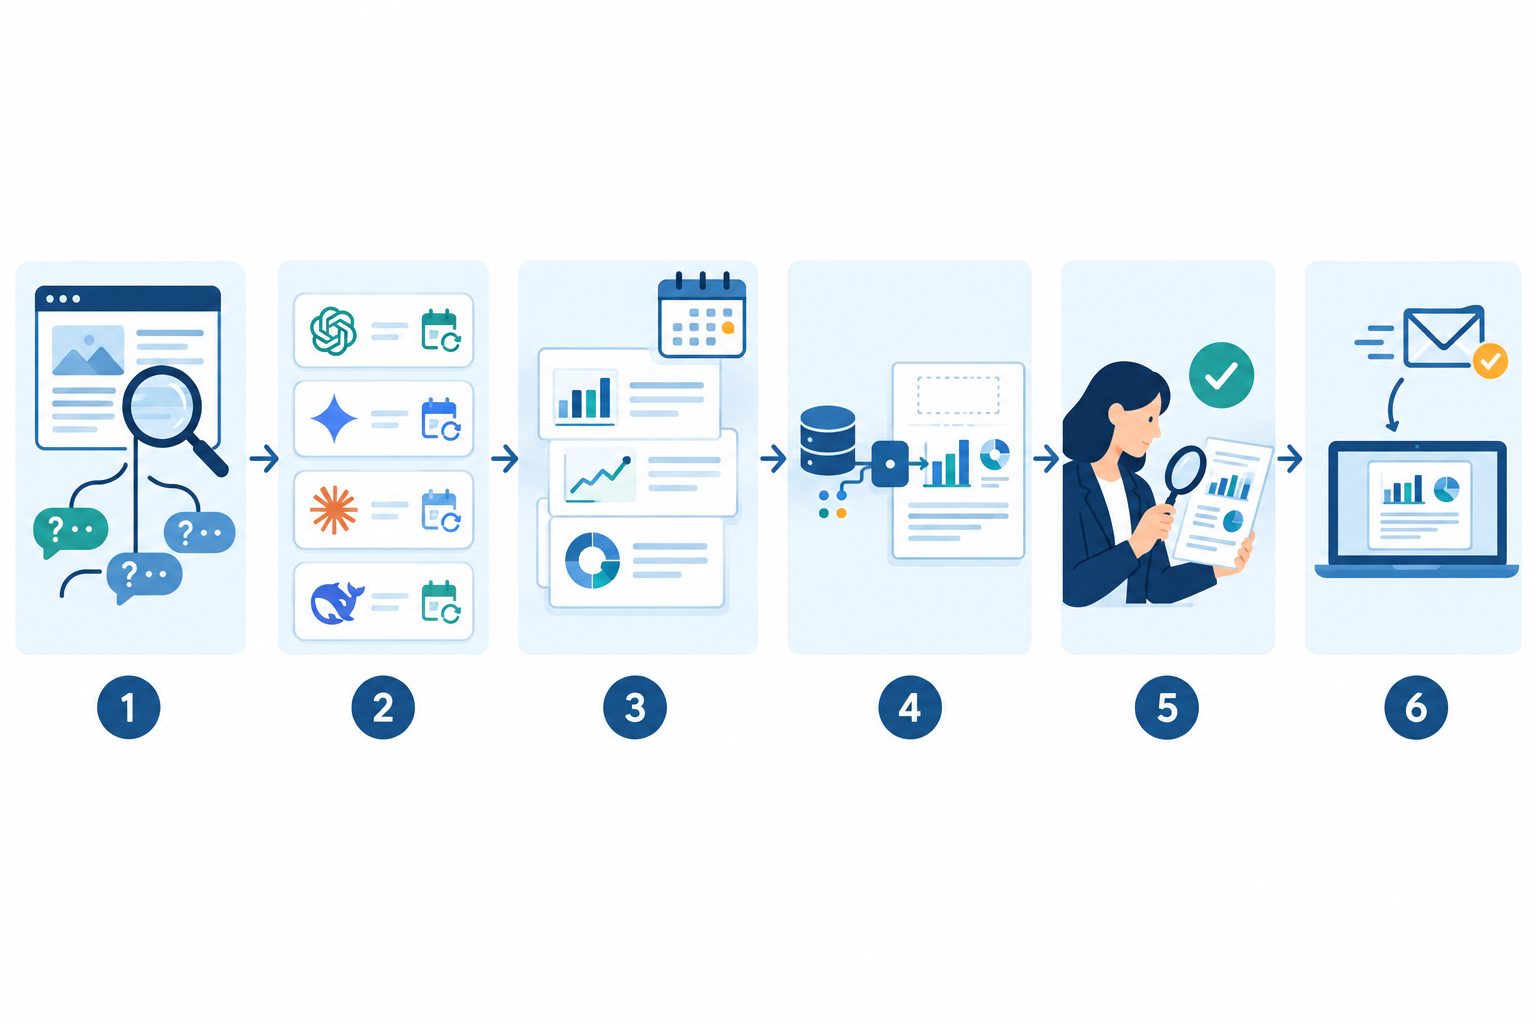
On delivery mechanics, Looker Studio's help documentation describes scheduled email delivery, including PDF attachments, so a recurring cadence to named client stakeholders needs no manual export. Confirm current options there, as features change. The AI visibility metrics and the review step are your own design.
How much time can automated AI reporting save?
Here is my own illustrative arithmetic, not a measured benchmark. Take a modest set of 40 questions across five platforms, which makes 200 manual checks. At roughly two minutes each to run the prompt and record the answer, citations and competitors, a single manual pass takes about 6.7 hours per client per month, and it gives you one sample rather than regular data. Automated collection removes that burden and leaves your time for the part clients pay for, which is interpretation.
Turning AI Visibility Reports Into Upsell Opportunities
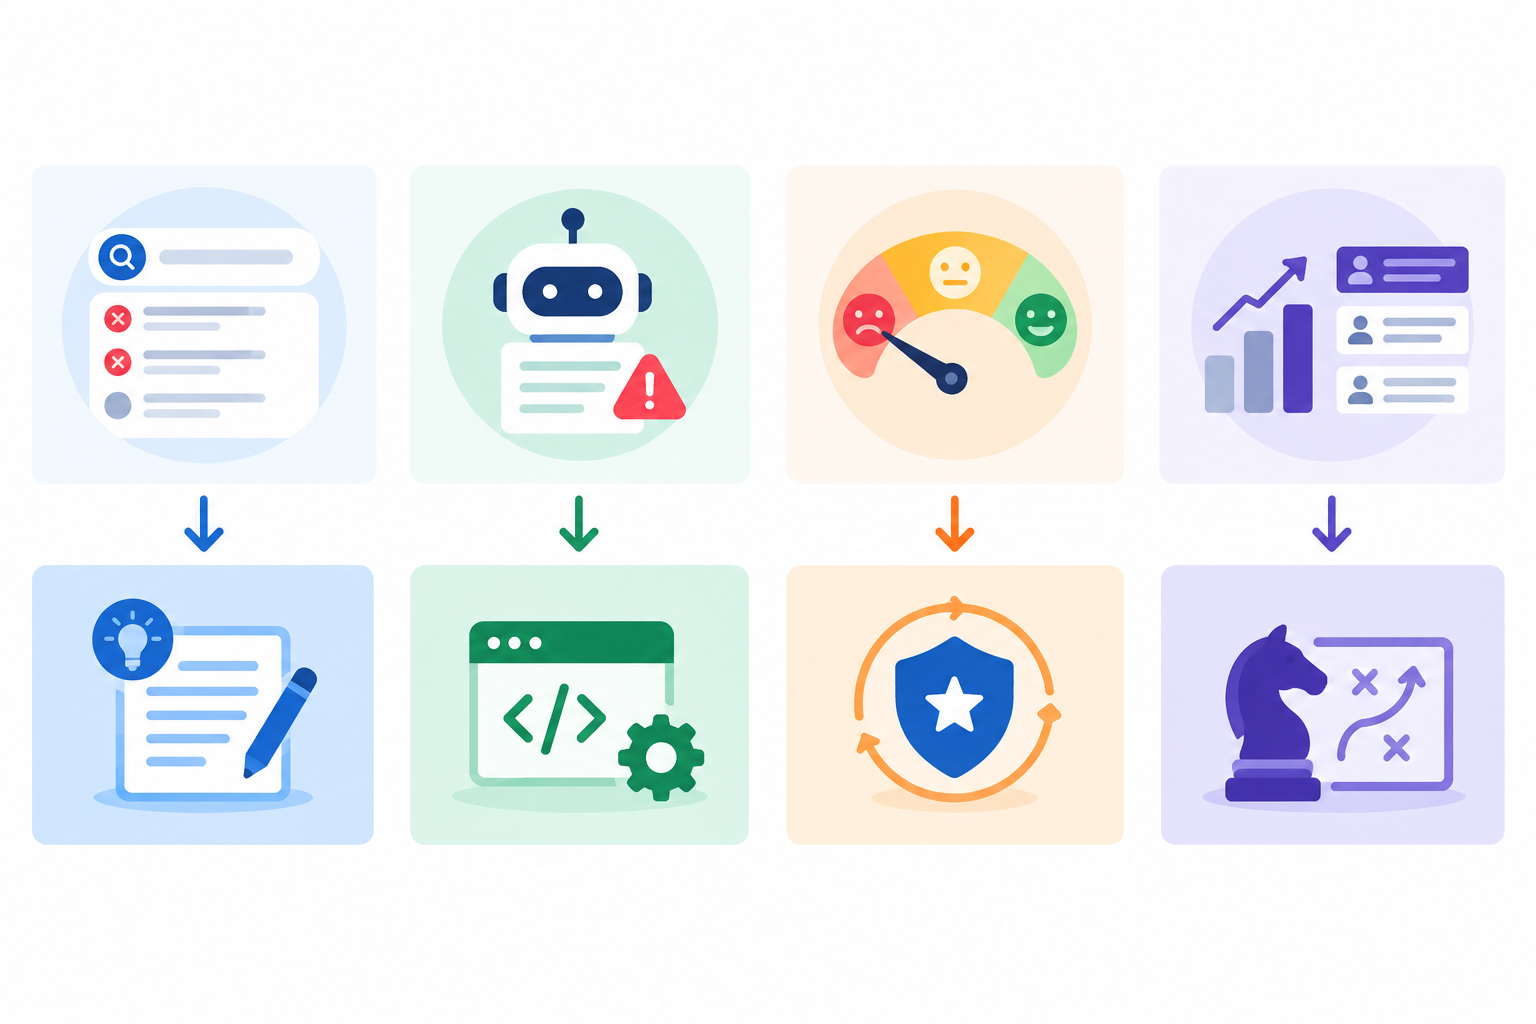
Each finding in a well-built report maps to a service you can sell:
- Content and generative engine optimisation retainers, when query gaps show competitors cited and the client absent.
- Technical fixes, sourced from readiness-audit failures such as structured data, crawl access and page clarity.
- Digital PR and citation building, when AI engines lean on review sites, publications or directories where the client is missing.
- Reputation work, when sentiment analysis turns up inaccurate or negative descriptions.
- Competitor response packages, when a rival's share of voice rises sharply.
- Quarterly strategy reviews that use trend data to justify budget decisions.
This also supports a tiered offer: a basic monitoring tier (the report and weekly checks), an optimisation tier with agreed monthly actions, and a premium tier that adds competitor deep-dives. Because the evidence sits in the report, a proposal reads as the logical next step and not a sales pitch, provided you are honest about what the data does and does not show.
How AI Visibility Reporting Can Support Client Retention
Regular reporting shows ongoing, visible work in a channel clients are anxious about, which strengthens your position as an advisor. It also builds a longitudinal data asset: the longer the engagement, the richer the trend history. And it gives account managers a reason to call every month, not only when something has gone wrong.
I want to be careful about the evidence here. Bain & Company's retention research associates a 5% increase in customer retention with a 25% to 95% increase in profits. Salesforce's State of the Connected Customer research reports that a large majority of customers rate the experience a company provides as important as its products and services. Both are general business findings, not studies of agency reporting or AI visibility, and the exact figures vary by edition and sector, so check the original publication before quoting them. Neither shows that a report causes a client to renew. I treat reporting as a transparent basis for strategy conversations, not a guarantee of retention.
Consider a hypothetical scenario, not a client result. An agency baselines a client in January at a visibility score of 28 and finds that competitors dominate comparison queries. It ships three content updates and two technical fixes, and records a rise to 47 by June, with share of voice up from 12% to 26% on the tracked prompt set. At renewal, the discussion can centre on the documented work and on whether to extend scope to the next category. The agency should still say plainly that score movement does not by itself prove business impact, and should pair it with referral and lead data where available.
Choosing a Platform for White-Label AI Monitoring
Because you will defend these numbers in client meetings, your monitoring source matters. These criteria apply to any vendor:
| Criterion | What to look for |
|---|---|
| Platform coverage | The AI engines your clients' buyers actually use |
| Run frequency | Regular runs, so trends are not built on sporadic samples |
| Scoring transparency | A documented score you can break into components, with weights, or a clear statement of what is proprietary |
| Competitor tracking | Named competitors and share of voice by platform |
| Evidence retained | Exact prompt, platform, date, cited sources and response snapshot |
| Sentiment | Classification you can spot-check, with quotable examples |
| Integration | API or reliable export for branded templates |
| Scale | Multi-client management and pricing that scales with your roster |
| UK fit | Ability to set UK location and language, pricing in sterling or clear currency terms, and a data processing agreement that addresses UK GDPR |
Transparency deserves particular emphasis. A black-box score is hard to defend when a client asks why it fell four points, while a score you can decompose, as in the worked example above, is far easier to explain. Test this in any vendor demo by asking them to walk through one month's score movement component by component. Confirm branded export options and data handling directly, and ask whether client prompts and results are stored, where, and for how long.
Disclosure: I work for MentionOwl, so treat this article as written from a vendor's perspective. We offer a $1, seven-day trial that you could use on a single pilot client, but run the same test with at least one alternative so you can compare question generation, report fit and score explainability on your own data.
FAQ: White-Label AI Visibility Reporting
What should a white-label AI visibility report include?
At minimum: an executive summary, a visibility score with trend, share of voice against named competitors, citation analysis, sentiment with real quotes, query-level results, technical readiness findings, referral traffic from your analytics, and recommended actions for the next 30 days. Add a short methodology note stating prompts, platforms, market and dates.
How do I explain AI visibility scores to non-technical clients?
Treat the score like a credit score or league-table position: a single number from 0 to 100 with agency-defined bands and a trend arrow. Then explain in one sentence what drives it, namely how often the brand appears in the tracked AI answers, how prominently it is cited, and how it compares with competitors. Always follow the number with what you will do next, and make clear it describes a tracked sample, not the share of shoppers who see the brand.
Can AI visibility reporting be automated monthly?
Yes, in large part. Collection, weekly digests and scheduled delivery can all be automated, and an API or export lets you feed results into your own branded dashboards or templates. I still recommend a short human review before each report goes out, to add context and catch anything misleading.
How often should agencies report on AI visibility?
Monthly is a sensible default for most clients, with weekly internal checks for early warnings. AI answers fluctuate day to day, so shorter reporting intervals tend to exaggerate noise, while quarterly reviews suit strategic conversations.
Is AI search share of voice the same as share of voice in traditional SEO?
Not quite. In AI search, share of voice reflects how often a brand is mentioned or recommended across a set of tested customer questions relative to competitors, whereas traditional measures rely on ranking positions and estimated clicks. Both are useful, but they answer different questions and should be reported separately.
How does AI visibility reporting help retain clients longer?
It gives clients regular, tangible evidence of what has been done and what has changed in a channel they are worried about, and it builds a trend history that deepens your advisory role. That supports renewal and scope conversations. But no research I know of shows that reporting alone causes retention, so I would present it as one part of a wider service relationship.