Building an AI Visibility Strategy Your Team Can Execute: A Practical Guide
A practical guide for UK marketing teams on building an AI visibility strategy: set baselines, assign ownership, prioritise fixes, and report share of

A strategy your team can actually execute rests on four things: a measured baseline, a named owner for each workstream, a list of fixes ranked by impact and effort, and a fixed review rhythm of daily data collection, weekly digests and quarterly strategy reviews. Teams that swap occasional manual prompting for systematic tracking of share of voice across ChatGPT, Claude, Gemini, Copilot and Perplexity can usually show leadership a defensible trend line within about one quarter. Meaningful movement from generative engine optimization (GEO) typically takes two to three quarters to compound.
This guide follows the order in which you would build the programme, so a head of marketing or SEO lead can move from spot checks to something that survives scrutiny in a board pack.
Why Ad Hoc AI Visibility Checks Fail the Leadership Test
Someone asks ChatGPT a question about your category, screenshots the answer, and drops it into Slack with 'we're not showing up'. It is a vivid image, but it is an anecdote, not data. Generative answers vary with prompt wording, date, location, model version and whether a search feature is engaged, and any of these can change which brands are named, in what order, and with which sources. A screenshot is one draw from a distribution, and you cannot tell whether it sits near the middle or out in the tail.
Leadership will ask four questions that a screenshot cannot answer:
- Are we recommended when buyers ask purchase-decision questions?
- Are competitors ahead of us, and by how much?
- Is our position improving or worsening?
- Which of our actions plausibly contributed?
The market context gives these questions real weight. Gartner forecast in February 2024 that traditional search engine volume would fall 25% by 2026 as users moved to AI chatbots and virtual agents. That is a forecast, not a measured outcome. Pew Research Center reported in June 2025 that 34% of US adults had used ChatGPT, up from 23% in 2023.
Pew's July 2025 browsing study of US adults' Google activity in March 2025 is the clearest argument I know for reporting AI visibility and traffic separately. An AI summary appeared on 18% of observed searches. When one appeared, users clicked a traditional result on 8% of visits, against 15% when none did, and they clicked a link inside the summary on about 1% of visits. Being present in the answer and receiving a visit are different outcomes, and a credible dashboard keeps them apart.
Most of the robust public data is American, so treat these figures as directional context and base your decisions on your own UK-market measurement. What I recommend is a move from spot checks to a repeatable system with defined metrics, named owners and a fixed cadence.
How to Set Baseline Metrics for AI Visibility
A baseline is the reference point against which every later claim is judged, and its value depends entirely on method. If prompts, market, platform or scoring change between periods, you end up reporting changes in method rather than changes in performance. Fix the method first, then collect.
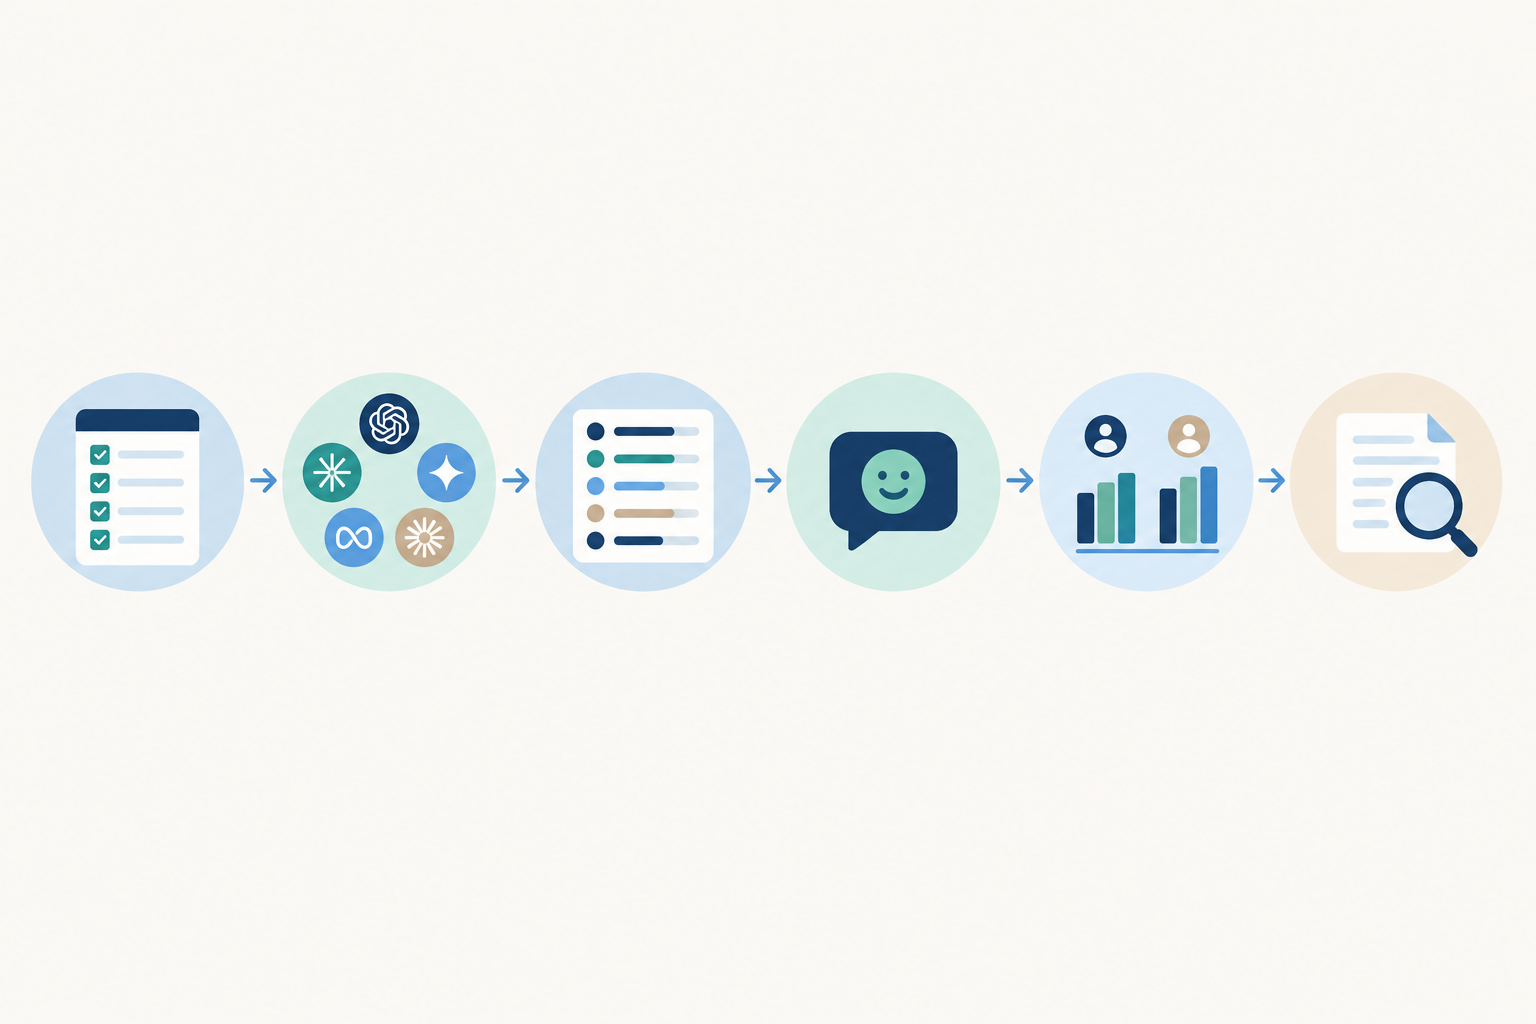
- Build a representative question set. Cover awareness, comparison and purchase-stage questions, phrased as a UK buyer would phrase them. Some tools can draft an initial set by crawling your site. Treat that as a first draft and edit it by hand for commercial relevance, because a question that never leads to a sale inflates coverage without informing any decision. Twenty to fifty questions is a workable starting range.
- Run the set across ChatGPT, Claude, Gemini, Copilot and Perplexity, and run it repeatedly. A single run is not a baseline.
- Record the components of any score. Log query coverage, position-weighted citations, share of voice and soft mentions (unlinked brand references) separately, so you can see where the weakness sits.
- Capture sentiment and framing. Note whether the brand is recommended or merely listed, and whether the description is accurate.
- Benchmark three to five named competitors. They give share of voice its denominator.
- Run an AI legibility audit covering crawlability for AI bots, indexation, structured data accuracy and content structure. Some tools package this as a fixed checklist. A passed checklist shows technical readiness, not that you will be cited.
What sampling protocol should you use for an AI visibility baseline?
These rules make runs comparable and give you a trend you can defend:
- Fix the wording. Store each prompt verbatim with a version number. Never edit a live prompt; add a new one.
- Fix the context. Use one market (UK) and one language (British English), and run in clean, logged-out sessions where the platform allows, to limit personalisation.
- Log every run. Record the date, platform, model version where disclosed, and whether web search was active.
- Repeat. Run each question at least three times per engine across the baseline period, because identical prompts can return different brands.
- Treat daily runs as correlated observations, not independent samples. They smooth noise but do not eliminate it.
- Annotate breaks. When a model update, new search feature or question-set change occurs, mark it on the time series. After a question-set change, run the old and new sets in parallel for two weeks so the two series can be bridged.
How to calculate AI visibility and share-of-voice metrics
The central metrics are only useful if anyone on the team can reproduce them. The scheme below is a convention I use, not an industry standard. If you buy a tool's composite score, ask for its components and weights, then keep whichever method you choose fixed across reporting periods.
Position-weighted citation points (per answer, per brand): first named = 1.0, second = 0.7, third = 0.5, fourth or fifth = 0.3, sixth or later or unranked mention = 0.1.
Query coverage = answers in which your brand appears ÷ total answers collected × 100.
Share of voice = your total citation points ÷ total points for all tracked brands (you plus competitors) × 100.
Visibility score (0-100) = 0.4 × coverage + 0.3 × share of voice + 0.2 × position quality + 0.1 × sentiment. Position quality is your average points per appearance × 100, and sentiment is the percentage of appearances framed as recommended or accurately positive.
Here is a worked example. Twenty questions across five engines gives 100 answers. Your brand appears in 34, so coverage is 34%. Your citation points total 20.4, against 41.0 for Competitor A, 27.6 for Competitor B and 11.0 for Competitor C, a total of 100.0, which puts share of voice at 20.4%. Position quality is 20.4 ÷ 34 × 100 = 60, and 70% of your appearances are framed positively. The visibility score is (0.4 × 34) + (0.3 × 20.4) + (0.2 × 60) + (0.1 × 70) = 13.6 + 6.1 + 12.0 + 7.0 = 38.7, which we report as 39.
Two supporting records belong outside any visibility tool. First, keep your conventional search metrics (impressions, clicks, click-through rate, average position), because Google's documentation states that AI feature traffic is included in overall Search Console Web reporting rather than broken out. Second, record a baseline for AI referral sessions and conversions using consistent channel definitions, and annotate any tracking changes.
What does a realistic AI visibility baseline look like?
Expect low coverage at the outset, particularly on non-branded queries where you compete against established names. Treat the first 7 to 14 days as calibration, when you find out which questions are noisy and which competitors you overlooked.
Your baseline is a range, not a single figure. Take the daily share of voice across the calibration period and calculate the mean and standard deviation. If the mean is 8.5% and the standard deviation is 1.4 points, a working range is roughly 5.7% to 11.3% (mean ± two standard deviations). Publish that range alongside the question set, engines and market, so a change to the prompt set cannot masquerade as a performance shift.
Which AI Visibility Metrics Should Leadership Track?
Not every metric deserves a slot in an executive report. These are the seven I track, and who each one serves.
| Metric | What it tells you | Who it matters to | Reporting frequency |
|---|---|---|---|
| Overall visibility score (0-100) | Composite health of your AI presence | Marketing director, board | Monthly |
| Share of voice vs named competitors | Relative position in AI answers | Marketing director, product marketing | Weekly review, monthly report |
| Query coverage | Share of tracked questions where you appear | SEO and content leads | Weekly |
| Position-weighted citations | How prominently you are cited | SEO and content leads | Weekly |
| Sentiment | Accuracy and tone of brand description | PR and brand | Weekly, with alerts |
| AI referral traffic | Visits from AI platforms | Marketing director, performance team | Monthly |
| AI legibility audit pass rate | Technical readiness for AI crawlers | SEO and development | Monthly |
Share of voice should be the executive headline. It is relative, so it answers the competitive question directly. It mirrors the paid and organic share-of-voice reporting leadership already understands. And it exposes the case where your score rises while a rival's rises faster.
I also separate leading indicators (legibility fixes shipped, pages updated, content published) from lagging indicators (citations, share of voice, AI-referred sessions). Leading indicators show the team is working, and lagging indicators show whether the work is landing. Report only the lagging ones and the first quarter looks discouraging. Be wary of vanity metrics as well: fifty mentions on irrelevant questions are worth less than five on the questions that precede a purchase.
Who Should Own AI Visibility Across Content and SEO Teams?
One accountable owner, usually the head of SEO or content strategy, with clear contributors elsewhere. Under the RACI principle, each workstream has one person Accountable for the outcome, others Responsible for tasks, and some Consulted or Informed. Shared ownership without an accountable individual stalls, because everyone assumes someone else is chasing the fix.
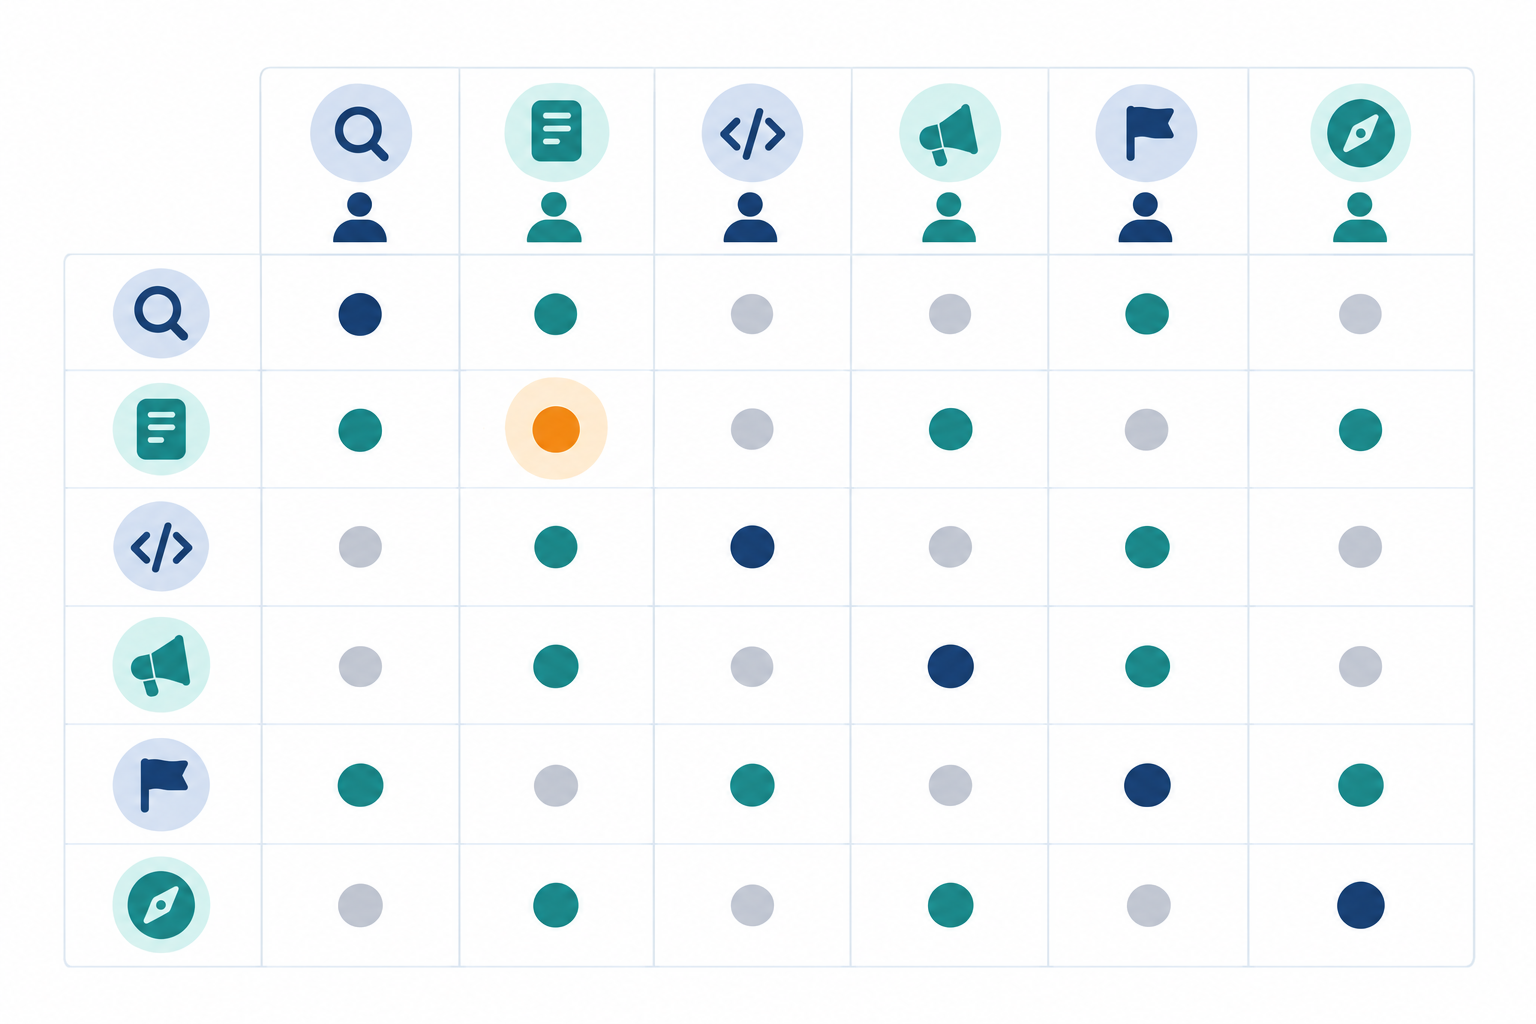
| Workstream | Accountable | Responsible | Consulted | Informed | Typical output |
|---|---|---|---|---|---|
| Measurement and reporting | Head of SEO | SEO/analytics lead | Product marketing | Marketing director | Weekly digest |
| Content and answer quality | Head of content | Content team | SEO lead, product marketing | PR | Approved page updates |
| Technical AI legibility | Head of SEO | Development | Content lead | Marketing director | Shipped technical fixes |
| Brand and sentiment | Head of PR/brand | PR team | Content lead, legal | Marketing director | Accuracy corrections, third-party mentions |
| Competitive intelligence | Product marketing lead | Product marketing | SEO lead | Marketing director | Competitor citation review |
| Executive reporting | Marketing director | Head of SEO | All workstream owners | Leadership team | Monthly one-pager |
Adapt this to your structure. Smaller teams and solo founders can collapse roles, and often have to. Keep one separation intact, though: the person who ships a fix should not be the only one judging whether it worked, because that is how optimistic readings of noisy data creep in.
GEO extends SEO rather than replacing it. Google states that AI Overviews and AI Mode rely on the same foundational requirements as other Search features, with no special markup needed. Your SEO team already owns crawlability, indexation and content quality, and those remain the foundation. Weekly digests keep owners informed without anyone logging in, and if you want the data in existing dashboards, check whether your tool offers an API.
How to Prioritise AI Visibility Fixes by Impact and Effort
Measurement produces a long list of gaps, and the discipline lies in choosing which to close first.
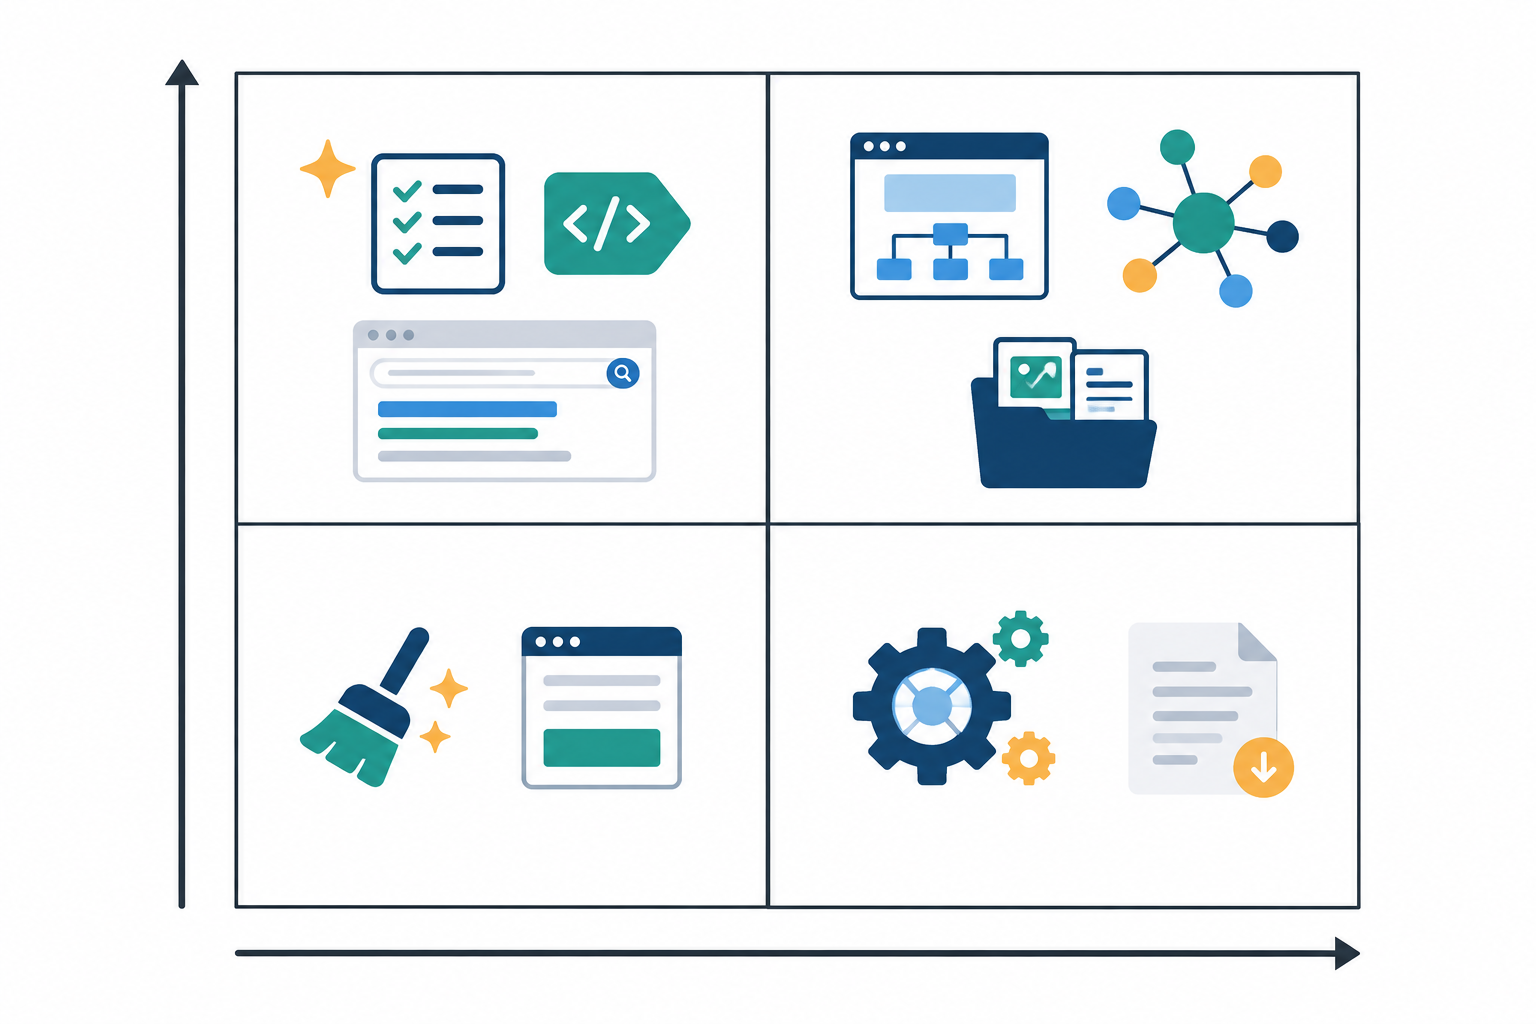
- Pull the gap list. Collect the questions where competitors are cited and you are not, the questions where you appear with negative or inaccurate framing, and the technical failures from the audit.
- Score each item. For impact, weigh the commercial value of the query, the number of engines affected and competitor strength. For effort, weigh hours, dependencies and approvals. Add two further criteria: confidence in the diagnosis, and whether the result will be measurable.
- Sort into three bands. Quick wins are access and eligibility faults: AI crawlers blocked unintentionally, stray noindex tags, broken canonicals, content that fails to render for bots. Medium projects include rewriting key pages to answer questions directly and adding evidence and original data. Long-term plays cover earning third-party citations, reviews and authoritative mentions.
- Commit to a sprint-sized backlog. Five to ten items per month beats a wish list nobody finishes.
- Tag each fix to the metric it should move. This makes later assessment possible, though not conclusive.
Structured data needs a precise note. Google says no special markup is needed for its AI features, so adding schema is not an AI visibility quick win in itself. Treat it as hygiene: make sure any markup is valid and matches visible page content, because that helps search features generally.
AI visibility prioritisation example: a UK business-insurance broker
Imagine a UK business-insurance broker. The audit shows three gaps: (a) for 'best business insurance for small UK contractors', two competitors are cited and the broker is not; (b) two engines carry an outdated FCA-related description of the broker; and (c) a robots.txt rule blocks OAI-SearchBot.
Item (c) goes first. It is a single configuration change, and OpenAI's documentation says that sites opted out of OAI-SearchBot will not be shown in ChatGPT search answers, though they may still appear as navigational links. The expected impact rests on that documentation, not on a measured uplift, so we confirm the change in server logs and re-run the question set. Item (b) goes second: moderate effort, but high commercial and reputational risk. Item (a) carries the highest commercial value but needs a new comparison page and third-party mentions, so it starts now and is judged over quarters. The ranking is a judgement, but it is a documented one that leadership can challenge.
On crawlers, OpenAI documents OAI-SearchBot as the crawler used to surface sites in ChatGPT search, distinct from GPTBot, which relates to model training. Allowing one does not allow the other, so set robots.txt in line with your policies. For Google, pages must be indexed and eligible to appear with a snippet to be considered as supporting links in AI features.
It is also worth analysing which domains the engines cite for your priority questions. If answers lean on review sites, trade publications or comparison pages, no amount of on-site rewriting substitutes for appearing there. Microsoft's AI Performance reporting in Bing Webmaster Tools, which covers Copilot citations and grounding queries, can help you separate a content gap from an authority problem.
For content changes, the academic GEO paper (Aggarwal et al., ACM SIGKDD 2024) found that adding citations, quotations, statistics and authoritative sources improved visibility by up to 40% in its benchmark. That is a research result, not a live-engine guarantee, so test it. Change the commercially important pages first and leave comparable pages untouched as a rough control.
How to Build an AI Visibility Monitoring Cadence
How often should you review AI visibility progress? Use a tiered rhythm, with effort rising as the horizon lengthens:
- Daily (automated): the question set runs against all engines, with alerts for sharp drops or negative sentiment.
- Weekly (30 minutes): review the digest, note share-of-voice movement and new competitor citations, and log changes shipped.
- Monthly (60 to 90 minutes): review backlog progress, reprioritise fixes, and compare AI traffic analytics with visibility trends.
- Quarterly (half day): the strategic review below.
Daily collection matters because repeated runs smooth the noise that single checks cannot. Since daily runs are correlated observations, use weekly averages when you make judgements.
Keep one shared change log recording what shipped, when, and who owned it. Without it, correlations get explained after the fact, and usually flatteringly.
To separate signal from noise, use your own data rather than a rule of thumb. Calculate your baseline range from the calibration period as described earlier, then update it each quarter. Investigate when weekly averages fall outside the range for two consecutive weeks, ideally on more than one engine. A drift confined to one engine usually points to a platform change, while a move across several points to something you did or something a competitor did.
How to Report AI Visibility to Leadership
A one-page monthly report works best, with five elements: the headline visibility score and its trend, share of voice versus named competitors, three wins, three risks, and next month's priorities. Brevity forces you to decide what matters.
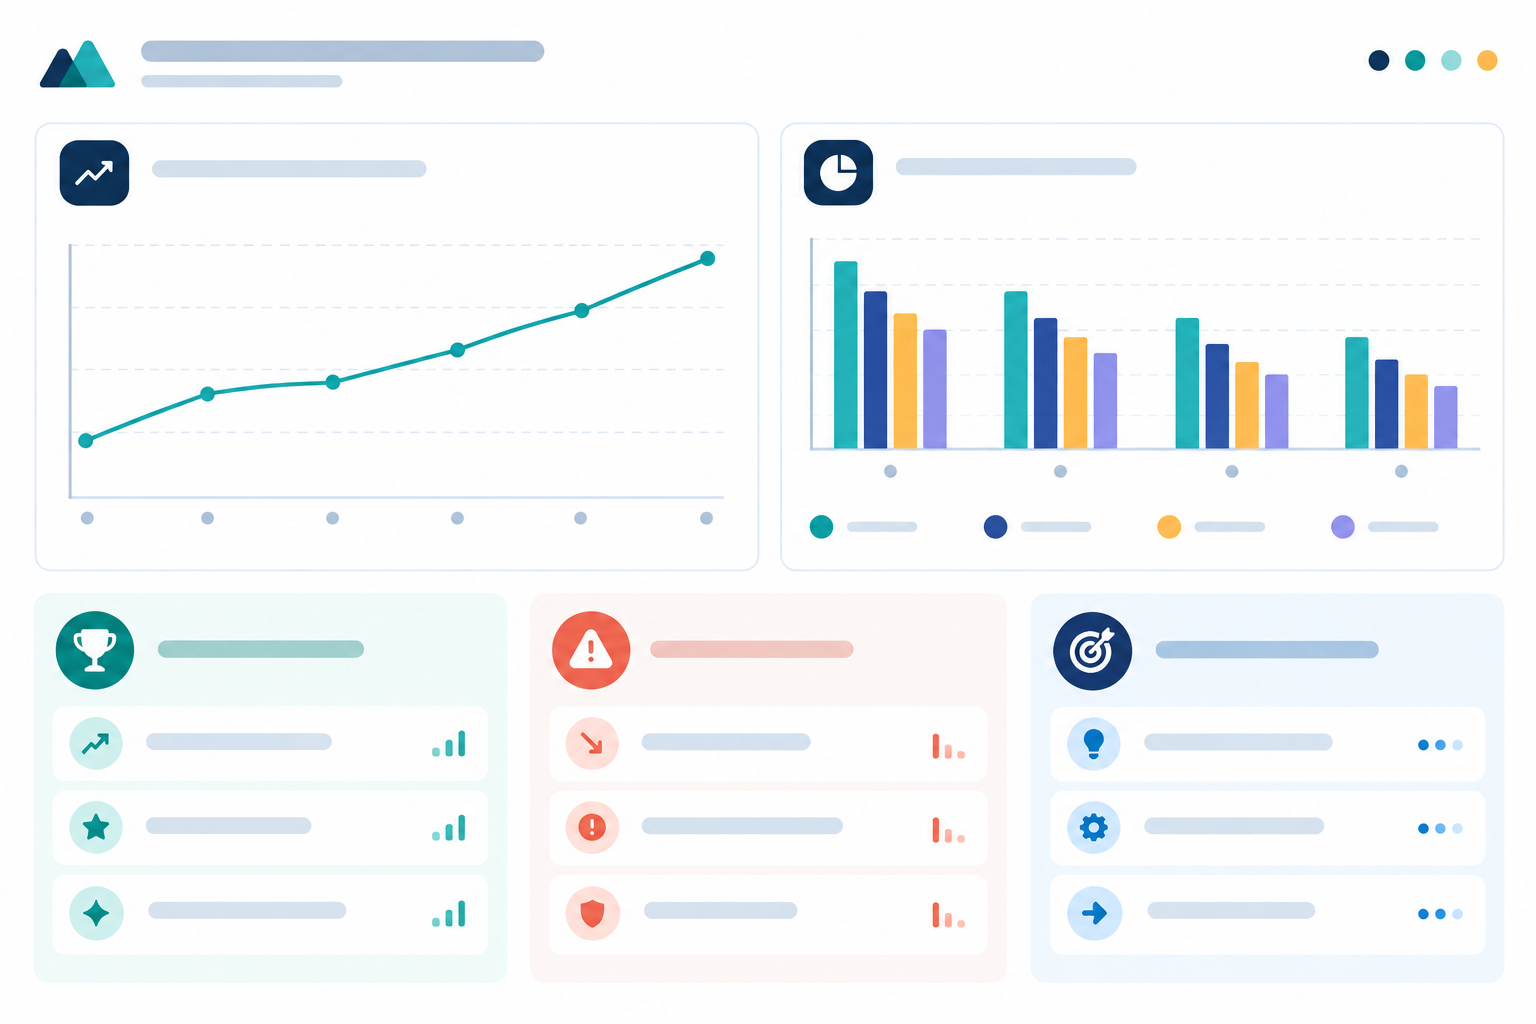
Show the sample on the page: question count, engines, market and reporting period, plus a note that the score is a trend indicator, not a business outcome. A chart of you against three rivals says more than any absolute figure, and in my experience leaders respect a caveated number more than a confident one that later unravels.
Connect visibility to outcomes through supporting indicators: AI-referred traffic, branded search lift and sales-team anecdotes about prospects who mention AI assistants. Given Pew's finding that clicks from AI summaries are rare, much of the value of being cited may never appear as a referral, so do not judge the programme on traffic alone.
For UK teams, report on UK-relevant queries and phrasing, including British spellings, local retailers and UK regulation where relevant. An answer shaped for a US shopper may name entirely different providers from the ones a buyer in Manchester sees.
How to Review and Adjust Your AI Visibility Strategy Quarterly
The quarterly review is where the programme either compounds or drifts.
- Compare against the baseline. Set visibility score, share of voice, coverage and sentiment alongside your baseline ranges.
- Audit what worked. Match change-log entries to the metrics they were tagged against, and retire tactics that showed no effect. A fix that coincided with a gain has not been shown to have caused it, particularly when several changes shipped together.
- Refresh the question set. Remove stale questions, add emerging ones, and document the changes, bridging old and new series as described above.
- Reassess the competitor set. New entrants can appear quickly in AI answers.
- Check for platform changes. Model updates and new search features can shift results independently of anything you did.
- Reset targets, ownership and resourcing, including technical eligibility: indexation, crawlability, OAI-SearchBot access and whether structured data matches visible content.
What's a reasonable timeline to see AI visibility results?
Technical access fixes may show effects within weeks. Content improvements typically take one to two quarters, and third-party authority building two to three quarters or more. These timelines are indicative, since they depend on category competitiveness and your starting point. Plan around a trend over two to three quarters, and promise leadership a trend line, not a number.
Common AI Visibility Pitfalls and How to Avoid Them
- Treating a single prompt as evidence. Repeat, aggregate and report ranges.
- Tracking only brand-name queries. You will miss the non-branded, purchase-decision questions where competitors win.
- Optimising for one engine. Each platform draws on different sources.
- Ignoring sentiment and accuracy. Being mentioned but poorly described can be worse than absence.
- Changing the method mid-series. Unrecorded prompt or weighting changes break comparability.
- Changing too many things at once. Keep the backlog small and tagged.
- Letting ownership drift. Put the owner and cadence in writing and revisit them each quarter.
Frequently Asked Questions About AI Visibility
Who on the team should own AI visibility?
One accountable owner, typically the head of SEO or content strategy, because the work builds on existing search and content disciplines. Technical, PR and product marketing contributors own specific workstreams, as the RACI table shows.
How do I set a realistic AI visibility baseline?
Run a representative question set across several engines, repeatedly, for one to two weeks under a fixed sampling protocol. Calculate share of voice with a stated formula and report the result as a range.
How often should we review AI visibility progress?
Daily automated collection, a weekly digest, a monthly backlog review and a quarterly strategy review.
What's a reasonable timeline to see results?
Weeks for technical access fixes, one to two quarters for content, and longer for third-party authority. Plan around two to three quarters.
Is generative engine optimization different from traditional SEO?
They overlap heavily, since clear structure, authoritative content and crawlability help both. GEO adds a focus on being cited and recommended within synthesised answers, which raises the importance of source authority, direct answers and sentiment.
Where to Start This Week 🦉
In one week, agree the question set, name the accountable owner, write down the scoring method, and start daily tracking so the baseline begins accumulating immediately. Everything else depends on that first body of consistent data. If budget approval is the obstacle, a short trial can help you validate your question set. MentionOwl, the tool we build, offers a $1, 7-day trial (vendor-provided information; check current terms on its site). Seven days covers only half the recommended calibration window, so use it to test the set, not as a finished baseline. The method matters more than the vendor.