Adding AI Visibility Metrics to Your Marketing Dashboard: A Practical Integration Guide
Build a smarter marketing dashboard: integrate AI visibility metrics, share of voice and citation data with Looker, Tableau and your UK reporting stack
A systems-integration walkthrough for UK marketing operations teams combining AI visibility, share of voice and citation data with the BI tools they already use for web and paid media reporting.
The fastest way to add AI visibility data to a marketing dashboard is through an API feed that pulls visibility scores, share of voice and citation counts into the same BI tool you already use for web traffic and paid media reporting. MentionOwl's REST API exposes these data points (check the current field list in MentionOwl's own API documentation before you build, since vendor schemas change more often than GA4's do).
The practical implication is that you do not need to create a separate reporting workflow simply because the source is generative AI rather than Google Analytics. The data model has the same basic shape as the information you already report — a metric, a date, a segment and a trend line. The real work is mapping fields, choosing a sensible refresh cadence and being clear about what each metric can and cannot tell you.
This matters more than it might seem. I spend most of my week inside dashboards built for UK marketing teams, and the pattern I keep seeing is AI visibility treated as a curiosity — a screenshot in a Slack thread — rather than as a core reporting input alongside GA4 and Search Console. That is the mistake this guide aims to help you avoid.
Why AI Visibility Metrics Belong Next to Traditional Analytics
Traditional web analytics platforms are very good at measuring visits, clicks, conversions and assisted conversions. What they are structurally unable to show you is whether your brand was mentioned, recommended, cited or quietly omitted when someone asked ChatGPT, Perplexity or Gemini a purchase-decision question.
GA4 and Search Console documentation are explicit on this point: their measurement scope is web sessions and search impressions, not generative answer content. AI visibility metrics are designed to complement that data, not replace it. However, leaving them out entirely creates a real reporting gap. It is worth being precise about what kind of gap it is, because AI visibility, AI-generated search summaries, chatbot citations and AI referral traffic are related but distinct concepts that measure different parts of the funnel.
Most public research on how this gap is widening comes from the US, and I want to flag that clearly rather than presenting it as universal. Pew Research Center's March 2025 study found that Google displayed an AI-generated summary in roughly 18% of the searches it analysed among a panel of US adults. Searches producing an AI summary led to a click on a traditional result only 8% of the time, compared with 15% when no summary appeared. About 26% of AI-summary searches ended the session entirely after the summary, compared with 16% of non-summary searches.
Gartner has forecast that traditional search engine volume could decline by 25% by 2026 as more users shift to AI chatbots. That is a forecast, not a historical fact, and it is US-weighted, but it is a reasonable planning assumption for anyone building a marketing reporting stack designed to last more than a quarter or two.
There is not yet a UK-specific equivalent of the Pew study, which is itself worth noting. Ofcom's Online Nation research tracks UK internet and platform usage in detail but has not published comparable AI-summary click-behaviour data at the time of writing. Until that exists, I would treat the US figures as directional evidence of a trend rather than numbers to plug into a UK forecast model.
What UK teams can say with more confidence is that GA4 and Search Console — the two tools underpinning most UK marketing dashboards — were not built to measure generative answer content, regardless of which country the searcher is in.
There is a second reason AI visibility belongs in a marketing dashboard: leadership expects one source of truth. I have watched well-intentioned AI visibility reports get built as standalone PDFs or one-off Slack updates. Within two quarters, they are often forgotten because nobody wants to open a fourth tool during a leadership review. If the data does not live where the rest of the marketing metrics live, it effectively does not exist for decision-making purposes.
The risk compounds because a brand can look healthy in Search Console — with stable impressions, a decent click-through rate and no ranking losses — while being invisible or misrepresented in AI-generated answers. These are separate signal sources measuring separate behaviours.
Adobe Analytics recorded a 1,300% increase in generative-AI-sourced traffic to US retail sites during the 2024 holiday season compared with the prior year. This was from a small base and is US-only data, so it should not be read as evidence that AI traffic is replacing search traffic globally. It does confirm that the channel is no longer negligible.
Separately, SparkToro and Datos data suggests roughly 58.5% of US Google searches in 2024 ended without a click to an external site. A meaningful share of demand is being satisfied inside the answer interface, invisible to an existing analytics stack unless you are specifically measuring for it. If you are running consent mode or server-side tracking under UK GDPR and PECR requirements, that invisibility can be compounded further, since AI assistant referrers are frequently stripped or misclassified as direct traffic before they reach GA4.
What AI Visibility Metrics Should Go on a Marketing Dashboard?
Not every AI monitoring metric deserves a permanent home on your dashboard. Before listing the most useful metrics, it is important to be explicit about something the industry often glosses over: these measures are largely vendor-defined.
A visibility score of 72 from one monitoring tool is not directly comparable to a score of 72 from another. The underlying weighting of query coverage, citation position and share of voice differs by vendor and is not standardised across the industry in the same way as, for example, GA4's session definition. Treat the numbers below as internally consistent measures for tracking your own trend over time, not as benchmarks to compare with a competitor's self-reported score from another tool.
| Metric | How it's typically calculated | Data grain | Key limitation |
|---|---|---|---|
| Visibility score (0–100) | Vendor-weighted composite of query coverage, citation position and share of voice | Daily or weekly, per brand | Not standardised across tools — do not benchmark your score against a competitor's score from a different platform |
| Share of voice | Percentage of monitored queries where your brand is cited compared with named competitors | Per query category | Highly sensitive to which queries are monitored; small query sets can swing significantly week to week |
| Citation frequency and position | Count and rank of brand mentions across AI engines | Per platform, per query | ChatGPT, Gemini, Perplexity and Copilot do not expose citations identically — some surface sources clearly, while others do not |
| Sentiment | NLP classification of how a mention is framed | Per mention | Automated sentiment models frequently misread hedged, comparative or sarcastic language |
| AI referral traffic | Sessions attributed to an AI assistant referrer, often through cookieless methods | Per session | Referrer headers are commonly stripped, meaning volume is usually understated rather than overstated |
| Legibility audit score | Crawlability and structured-data health check | Per page or property | Leading indicator, not a real-time visibility measure — issues here can precede visibility drops by weeks, not days |
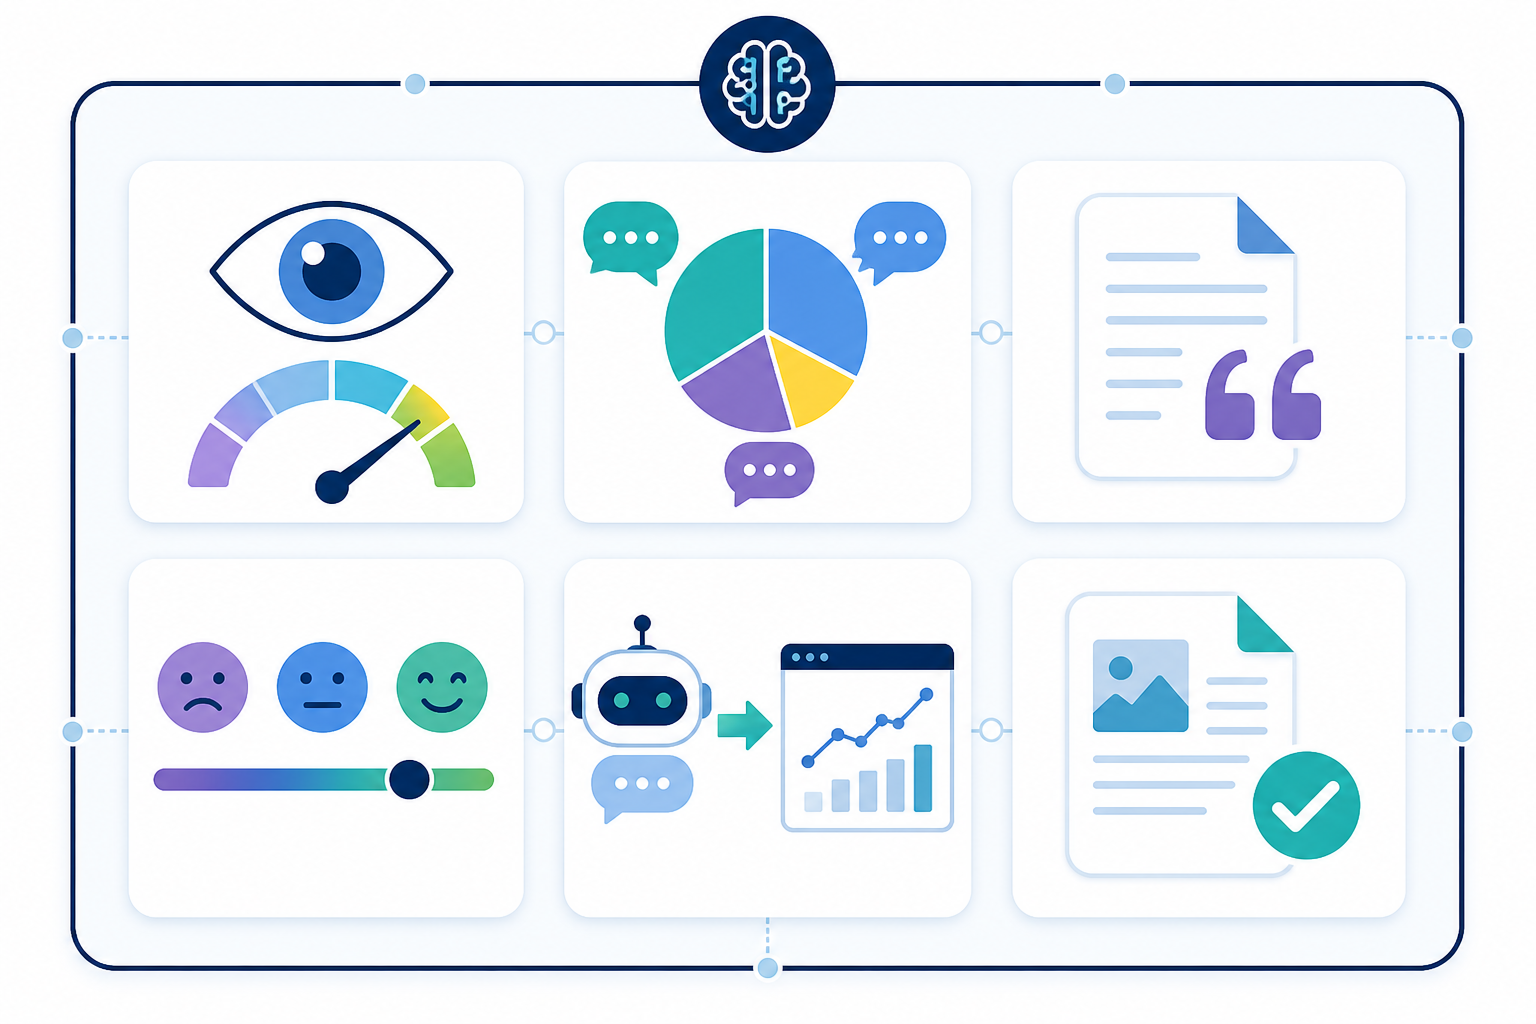
A few practical notes are worth adding to that table. Share of voice is more useful when tracked by query category than as one blended figure. A brand may dominate “best X for beginners” prompts while losing badly on “X alternatives” prompts — a distinction a single blended figure will hide.
Citation position matters roughly as much as frequency. Being cited third or fourth in a list carries meaningfully less commercial weight than being the first recommendation, in much the same way that a page-two Google ranking and a featured snippet are not equivalent even though both count as “visible”.
The legibility audit score also sits in a different category from the other metrics. It is a diagnostic input rather than a reporting-layer metric because technical crawlability and structured-data issues tend to appear in this score weeks before they show up as a visibility drop.
I would also encourage you to tie these metrics to a shared campaign or topic taxonomy — the same one you already use in GA4 for content grouping. This allows you to compare AI visibility, referral traffic, branded search demand and conversion rate by product category or intent theme, rather than treating AI data as a parallel universe with its own labelling system.
Using an API to Automate AI Visibility Data Feeds
Manually exporting spreadsheets from a monitoring tool every week is a workflow that usually dies within a month. Someone gets busy, the export is skipped and the dashboard goes stale without anyone noticing until leadership asks why the numbers have not moved.
An API feed avoids that failure mode, but it introduces a different set of engineering decisions that are worth making deliberately rather than defaulting into.
A representative payload shape (confirm exact field names against MentionOwl's current API reference, since this illustrates structure rather than quoting a guaranteed schema):
{
 "date": "2025-01-14",
 "brand": "YourBrand",
 "query_category": "best_project_management_tools",
 "platform": "chatgpt",
 "visibility_score": 68,
 "share_of_voice": 0.34,
 "citation_position": 2,
 "sentiment": "neutral"
}
Mapping that data into a warehouse table typically means creating a staging table with columns such as observed_at (stored in UTC and converted at query time rather than normalised to local time during ingestion), platform, query_category, brand, competitor, visibility_score, citation_position, sentiment and source_url where available.
A composite key of observed_at + platform + query_category + brand provides a workable basis for deduplication. This matters because retried API calls after a timeout could otherwise write the same day's data twice.
The sequence I would follow is:
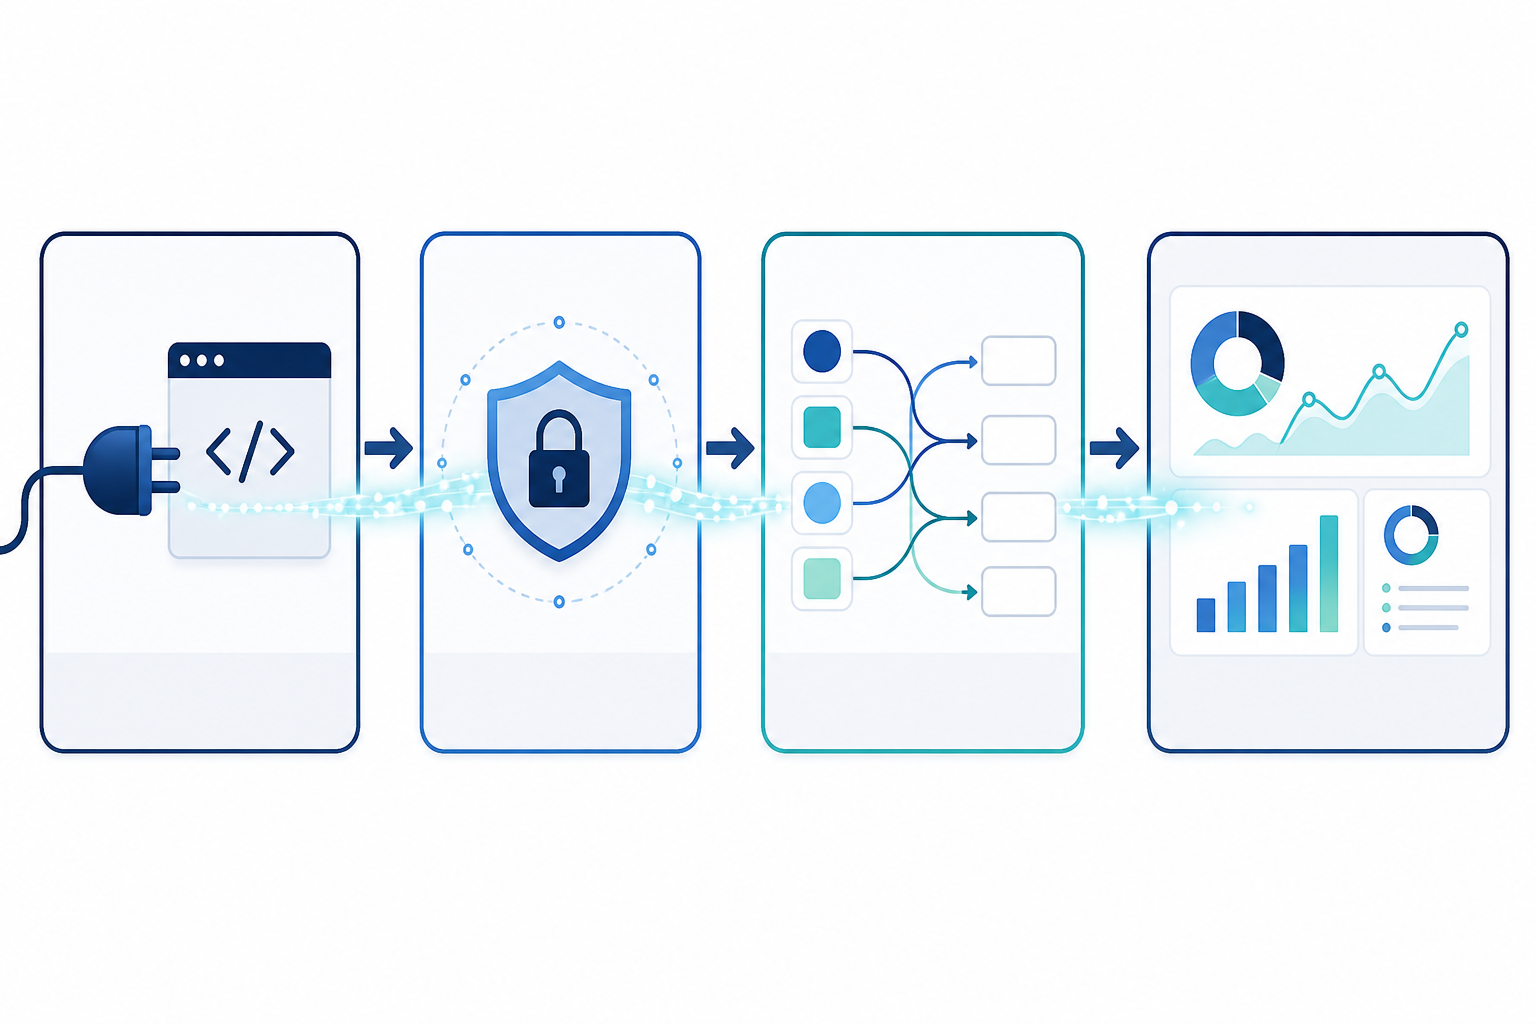
- Authenticate against the MentionOwl REST API and identify the endpoints you need. Visibility score, share of voice and citation data are typically separate calls, so map them out and confirm rate limits before building. Store the API key in a secrets manager rather than in the script itself, and use retry logic with exponential backoff for timeouts and 429 responses.
- Set a pull frequency that matches your dashboard refresh cadence. Daily pulls make sense if you are tracking a high volume of queries across several AI platforms where answers change quickly. A smaller team monitoring a handful of query categories may get equivalent insight from a weekly pull at a fraction of the API and engineering overhead. Match the cadence to how often the underlying number actually moves, not to what feels thorough.
- Map fields into your BI tool's data model, whether that is a native connector in Looker Studio, a Tableau data source or a scheduled script feeding a custom warehouse. Many teams use a lightweight serverless function that runs on a schedule, pulls the JSON response, reshapes it and writes it into the staging table described above.
- Normalise date fields and competitor naming conventions so the AI visibility data joins cleanly with your existing web traffic tables. This step is skipped more often than it should be and is a common reason for duplicate or missing rows. Run a historical backfill once the pipeline is stable, rather than capturing data only from the go-live date, so you have a trend line to show leadership on day one.
- Monitor the data pipeline itself. Set an alert if no new rows land within the expected window. A silent refresh failure is worse than no data at all because a stale dashboard can still look like a live one.
- Consider the MCP (Model Context Protocol) server option if your stack includes AI agents that need to query visibility data programmatically rather than through a conventional dashboard pull. This is a newer and less standardised part of the tooling landscape, so verify current support against MentionOwl's documentation before committing engineering time to it.
How to Visualise AI Visibility Alongside Web Traffic
Once the data is flowing, visualisation choices matter almost as much as the plumbing. It is also important to be upfront about a risk that is easy to overlook: overlaying two trend lines can lead readers to assume causation where there is only correlation.
| Use case | Recommended visual | Decision it supports | Common interpretation risk |
|---|---|---|---|
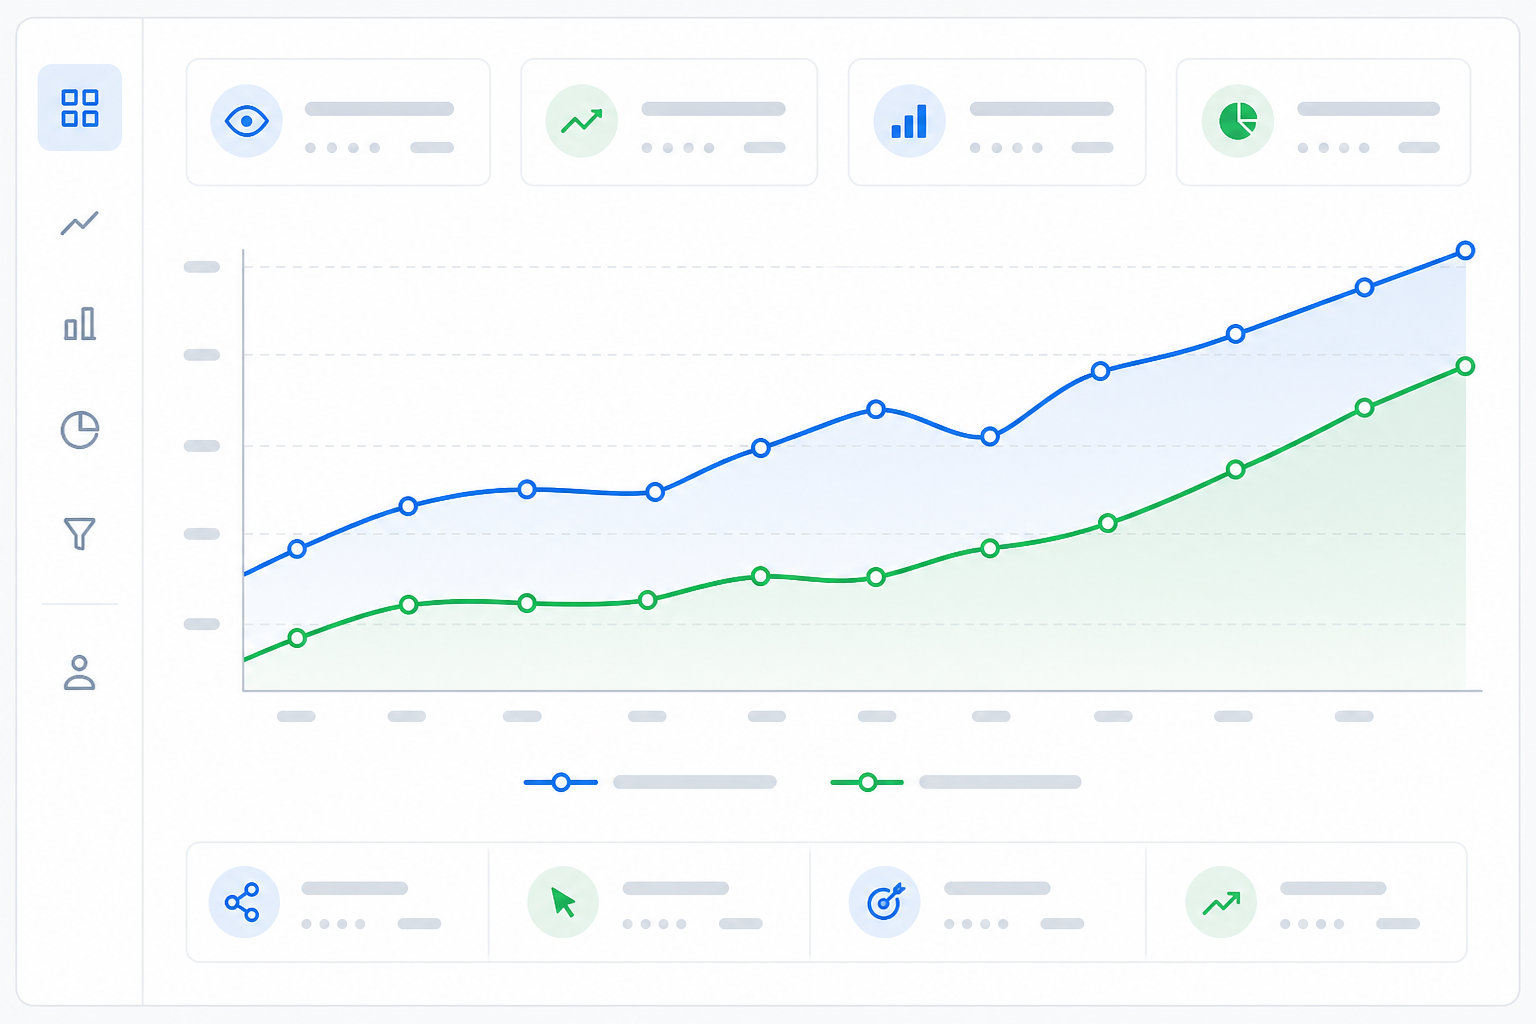
| Track visibility versus organic traffic over time | Dual-axis line chart with a shared timeline | Flags a divergence worth investigating | A rise in AI visibility and a dip in traffic happening together does not prove that one caused the other — annotate known events, such as content publishing or model updates, before drawing conclusions |
| Compare AI share of voice with named competitors | Leaderboard or bar chart alongside an existing search share-of-voice panel | Sets competitive priorities for the quarter | A blended share-of-voice figure can hide category-level losses that appear only when segmented by query type |
| Show the tone of AI-generated mentions | Colour-coded overlay on a citation-frequency chart | Flags reputation risk early | Automated sentiment scoring frequently misreads hedged, comparative or ambiguous language — manually spot-check a sample before acting on a sentiment dip |
| Summarise results for a leadership review | Weekly digest tile rather than raw daily data | Supports executive-level decision-making | Daily granularity is a diagnostic tool; treating a single day's swing as a signal rather than noise can lead to reactive, low-value discussions |
How to Avoid Dashboard Overload
Once you have API access, the temptation is to surface everything because it is technically available. I would resist that. A useful leadership marketing dashboard typically has three components:
- A small number of headline tiles: Visibility score, share of voice against two or three named competitors, sentiment and AI referral traffic are usually enough. Sixteen metrics on one screen makes it difficult for any of them to be read carefully.
- A separate diagnostic layer: Marketing operations teams can check query-level citation detail and legibility audit findings weekly rather than presenting them in every monthly leadership review.
- Threshold-based alerts: If share of voice falls by more than a defined percentage week over week, it should trigger a notification without requiring somebody to check charts manually each day.
Revisit the dashboard layout quarterly rather than treating it as fixed. AI platforms and query behaviour are evolving quickly, so a dashboard built six months ago may already be measuring the wrong things. A prompt category that was meaningful last quarter might need splitting or merging as new AI engines gain material query share.
Frequently Asked Questions About AI Visibility Dashboards
Can AI visibility data integrate with tools like Looker or Tableau?
Yes, in principle, since MentionOwl exposes its data through a REST API. In practice, check the current native connector list before assuming one exists for your specific BI tool. Connector availability changes, and where there is no native connector, a lightweight scheduled script that pulls and reshapes the JSON response into your existing data model works reliably as a fallback.
What metrics should go on a marketing dashboard?
For a leadership view, start with a visibility score, share of voice against a small number of named competitors, sentiment and AI referral traffic. Keep query-level citation detail, platform-level breakdowns and legibility audit findings in a separate diagnostic view. The right selection depends on your objectives, but every headline metric should support a decision rather than simply fill available dashboard space.
Are AI visibility scores comparable across different monitoring tools?
No. Visibility scores are vendor-defined composites, so a score from one tool is not directly comparable with a score from another. Use the number to track your own trend over time and to compare your brand with named competitors within the same tool, not as an external benchmark.
Is there an API to pull AI visibility data automatically?
Yes. MentionOwl provides a REST API for automated data feeds, along with an MCP server for teams running AI agents that need to query visibility data directly. Confirm current rate limits and authentication requirements in the vendor documentation before building a production pipeline around either option.
What happens if the API pull fails or the data is incomplete?
Build monitoring into the pipeline rather than relying on someone to notice a stale chart. A simple alert that fires when no new rows have landed within the expected refresh window will catch most failures before they reach a leadership review.
For incomplete data — such as a platform temporarily missing from the response — flag the gap visibly on the dashboard rather than silently interpolating or dropping it.
How do I avoid dashboard overload?
Audit every metric currently on screen and ask whether a leadership decision would actually change if that number moved. Anything that fails that test should move to the diagnostic layer rather than remain on the leadership view. In most cases, this cuts a dashboard from a dozen-plus metrics down to the four or five that people actually use.