The Marketing Team's Guide to AI Visibility Metrics That Matter
AI visibility metrics: learn whether query coverage, position-weighted citation share and sentiment predict business impact—not vanity numbers.
AI Visibility Metrics: Which Ones Actually Predict Business Impact?
AI visibility metrics are becoming essential for marketing teams that want to understand how their brands appear in ChatGPT, Google AI Overviews, Microsoft Copilot, Perplexity, and Gemini. But not all metrics are equally useful.
After a year spent building and testing scoring methodology for AI search monitoring, I've formed a clear view: query coverage and position-weighted citation share are the two numbers most worth a marketing team's attention. Raw mention counts and single-point sentiment scores, by contrast, tend to be vanity metrics — the kind that look impressive in a slide deck but tell you almost nothing about what a prospect actually saw or did.
I want to be upfront about the basis for that view. It's drawn from working directly with AI visibility data across dozens of brands, cross-referenced against traffic and enquiry patterns where we could get them — not from a peer-reviewed study. I'll flag the difference throughout this piece rather than blur it. If you've got bandwidth to track three numbers this quarter, my ranking is query coverage first, position-weighted citation share second, and sentiment trend third. This guide explains the reasoning in enough depth that you can defend it in a Monday leadership meeting.
Why AI Visibility Metrics Are Suddenly on Every Marketing Team's Plate
Something has shifted in how people find businesses, and most marketing dashboards haven't caught up. Between Google's AI Overviews, ChatGPT search, Microsoft Copilot, Perplexity, and Gemini, brand discovery is no longer a single-surface problem. Prospects can form an opinion about your company — sometimes a fully formed shortlist decision — without ever landing on a traditional search results page.
The numbers explain why leadership is asking about AI visibility metrics. McKinsey's 2025 State of AI survey found that 65% of organisations regularly use generative AI in at least one business function (McKinsey, 2025). Gartner has forecast that traditional search engine volume could fall by 25% by 2026 as people shift towards AI assistants for search-related tasks (Gartner, 2024). And Pew Research Center's 2025 analysis of Google search behaviour found that when an AI summary appeared, users clicked a traditional result only 8% of the time, versus 15% when no summary was shown, with a click on a link inside the AI summary itself happening in just 1% of cases (Pew Research Center, 2025).
Worth flagging for UK readers: these are primarily US-weighted datasets, and I haven't yet seen an equivalent, methodologically rigorous UK-specific study. Ofcom's ongoing work on AI adoption and online behaviour is the closest domestic reference point, and early indications suggest UK consumers are adopting AI search tools at a similar pace to the US, if slightly behind on trust. Until UK-specific figures mature, I'd treat the US data as directionally relevant rather than a precise forecast for a UK audience — and I'd weight that caution more heavily if you're in a regulated sector like financial services or healthcare, where UK-specific compliance content matters more than US source material.
The reporting gap is real regardless of geography. Traditional SEO dashboards were built to capture rankings, impressions, and clicks against a results page that behaves predictably. They were never designed to answer questions such as: does ChatGPT cite us when someone asks for the best option in our category? Does Perplexity's answer to a comparison question mention a competitor first? Is Gemini's recommendation accurate, or has it picked up an outdated claim from a three-year-old review?
This guide is deliberately a ranked list, not an exhaustive one. There are dozens of AI visibility metrics you could theoretically track. Most teams don't have the time, and most of those metrics don't deserve it. What follows separates the metrics that predict outcomes from the ones that simply generate activity.
Vanity AI Visibility Metrics vs. Metrics That Predict Business Impact
Two metrics get leaned on far more than the evidence supports.
Total number of AI mentions is the first. It tells you nothing about context, position, or intent. A brand can rack up fifty mentions across low-value, low-intent prompts while a competitor gets five mentions on the exact comparison questions that drive purchase decisions. Here's a concrete version of that scenario: imagine Brand A appears fifty times across prompts like "what is [category] used for" — generic, top-of-funnel, unlikely to convert soon. Brand B appears only five times, but every one of those five is on prompts like "best [category] for small business" or "Brand B vs Brand A pricing." Brand B's five mentions sit closer to the moment of decision. Raw mention count treats fifty as better than five. It isn't.
A generic AI visibility score with no visible breakdown is the second. If a platform hands you a single number between 0 and 100 with no component detail, you can't diagnose a decline or defend an improvement when someone asks why it moved. A composite score can still be useful — but only as a summary of named components you can open up and inspect, never as a substitute for seeing those components. If the score drops five points in a week, you should be able to say which underlying number caused it.
| Vanity Metric | Metric That Predicts Impact |
|---|---|
| Total AI mention count | Query coverage across purchase-decision questions |
| Single opaque visibility score | Position-weighted citation share, with components visible |
| One-off sentiment snapshot | Sentiment trend over time, with sample size shown |
| Mentions with no competitor context | Share of voice versus top competitors |
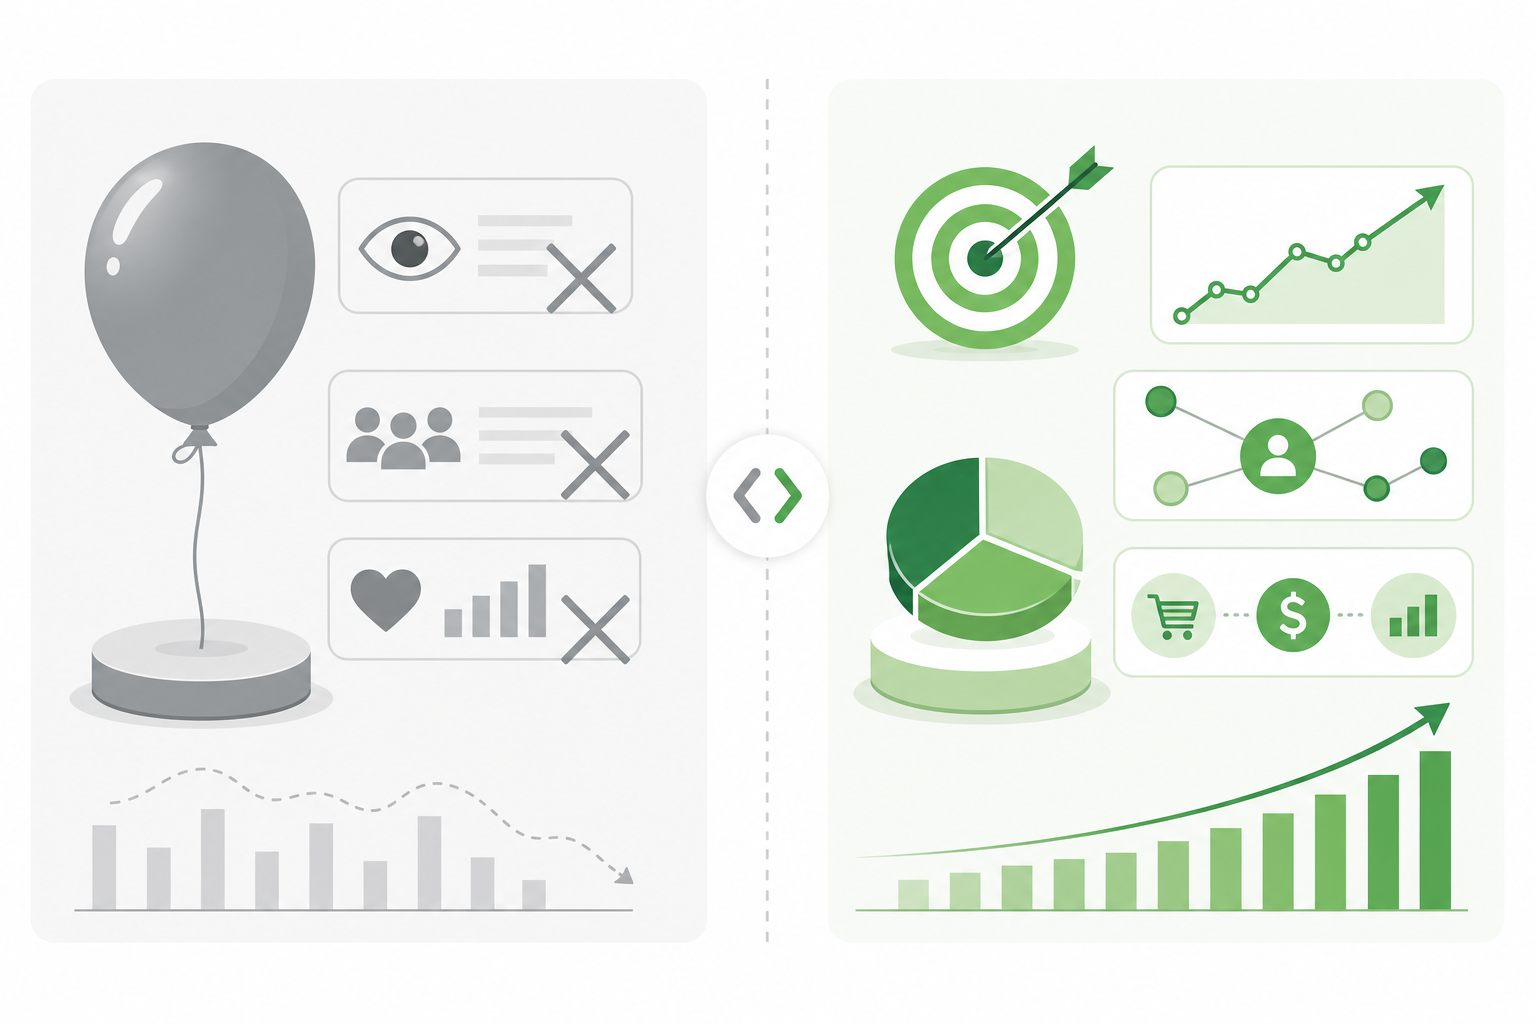
The pattern across the right-hand column is that these metrics measure quality, position, and trend rather than volume. That distinction is the entire thesis of this guide. Every metric here also needs to be weighted by query intent — a mention on a branded comparison question and a mention on a vague informational question are not the same signal, even when both metrics technically "count."
Query Coverage: Are You Being Mentioned in Relevant AI Answers?
Query coverage is the foundation metric. Everything else in AI visibility reporting is close to irrelevant if this number is near zero.
Query coverage is the percentage of relevant customer questions where your brand appears at all in an AI answer. Not first, not prominently, not favourably — just present. It's a binary per-question measurement (appeared or didn't) aggregated across a representative set of prompts.
A relevant question set typically spans four categories: branded queries ("is [brand] any good"), category queries ("best [category] in the UK"), comparison queries ("[brand] vs [competitor]"), and problem-solving queries ("how do I fix [problem the product solves]"). Branded and comparison queries tend to sit closer to purchase intent, so I'd weight coverage on those more heavily than coverage on broad informational queries when reporting the headline number.
Query coverage sits before position-weighted citations in my ranking because position and sentiment only become meaningful once you've established you're in the conversation at all. A perfectly positioned citation on a question nobody's asking about your category won't move revenue. But zero coverage on the questions that matter most means you're invisible at the exact moment a prospect is forming their shortlist.
It's worth distinguishing coverage from citations clearly, since the two get conflated constantly. Coverage asks: are you present in the answer at all? Citations go a level deeper and ask: how prominently, how often, and in what context are you referenced? You can have decent coverage with weak citations — mentioned by name but never credited as an authority or linked — and you can have strong citations on a narrow set of questions while overall coverage stays thin.
On benchmarks: treat any number you're given here with real scepticism. AI visibility measurement is new, varies enormously by category, and no independent body has published a rigorous industry standard yet. Any figures — including ranges I could quote from client work — reflect a specific, non-random sample and shouldn't be read as a target. Your own month-over-month trend is a far more honest signal than comparing yourself to an unverified average.
How to Measure Query Coverage Reliably
Because this metric depends entirely on how you sample questions, a few method choices matter more than people expect:
- Build a balanced query set. Aim for a mix across branded, category, comparison, and problem-solving intents — 20 to 40 questions is a workable starting point for most SMEs, more for multi-product businesses.
- Run each query more than once. AI answers vary between runs due to model updates and personalisation, even for the same prompt on the same day. A single run isn't a measurement; it's a snapshot with unknown noise.
- Log presence, position, and context consistently. Decide in advance what counts as "present" — named brand mention, linked source, or both — and apply that rule the same way every month.
- Report a range or confidence note alongside the trend. If coverage moved from 29% to 34%, note how many runs that's based on. A shift built on three repeated runs per question carries more weight than one built on a single pass.
You can do this manually with a spreadsheet and 30 minutes a week, or use a monitoring platform that automates the repeated runs — the method matters more than the tooling.
Position-Weighted Citations: A Better Measure of AI Search Prominence
Once coverage is established, position-weighted citations track more closely with consideration and click-through behaviour than any other single number I've looked at — with an important caveat I'll get to.
First, a precise definition, because "citation" gets used loosely. A citation, in this context, is any instance where an AI answer names your brand as a source, recommendation, or reference point — whether or not it includes a clickable link. Some platforms (Perplexity, Copilot) expose linked sources explicitly; others (ChatGPT's default mode) name brands within prose without a formal source list. That means "position" isn't always a clean, comparable ranking across platforms — it's an approximation of where in the answer your brand is named, and it should be treated as a useful internal comparison metric rather than a universal, standardised measure of user attention.
Here's a simple illustrative version of the weighting: assign position 1 a weight of 1.0, position 2 a weight of 0.6, position 3 a weight of 0.3, and anything beyond that a weight of 0.1. If your brand appears in position 1 twice and position 3 once across three tracked answers, your weighted share is (1.0 + 1.0 + 0.3) divided by the maximum possible (3.0), or roughly 77%. I want to be clear that these specific weights are a convention, not an industry standard — different platforms and analysts will choose different decay curves, so the absolute number matters less than whether your own weighted share is moving up or down over time using a consistent formula.
With that caveat in place, here's how I'd walk a team through using this AI visibility metric:
- Not all citations are equal. Being the first source named in an answer plausibly carries more weight with the reader than being named fifth, in the same way position one on a search results page outperforms position ten. This is a reasonable assumption based on attention research in traditional search, though it hasn't yet been independently validated for AI-generated answers specifically.
- Ten scattered low-position citations are a weaker signal than three consistent first-position citations. Volume without prominence tends to be a weak predictor of anything.
- Read the trend against competitor data. A flat citation count paired with declining position-weighted share is often an early sign a competitor is gaining ground, even before your absolute numbers move.
- Use persistent low position as a diagnostic trigger. If coverage is decent but position-weighted citations stay low, that's a signal to audit your content for the structural issues that tend to correlate with poor AI legibility — unclear headings, missing structured data, thin comparison content, or answers that don't directly address the question being asked.
Sentiment Trend: A Leading Indicator of AI Brand Perception
Sentiment earns third place in my ranking, but a single sentiment snapshot is close to worthless on its own. A sentiment trend, tracked consistently, can warn you about problems before they surface anywhere else in your reporting — provided you understand its limitations first.
The mechanism: generative AI systems synthesise brand perception from reviews, forums, news coverage, and third-party discussion, not just your owned content. A shift in third-party sentiment can influence how AI engines describe or recommend you before that shift ever shows up in your web analytics.
But AI-generated sentiment classification is genuinely unreliable in ways worth naming plainly. Different models can classify the same source text differently. Sample sizes are often small — a handful of mentions per month for a smaller brand — which means a "trend" built on five data points can be noise dressed up as signal. And sentiment models can pick up outdated or superseded information (a resolved complaint from eighteen months ago, an old pricing error) and weight it the same as something current. For all these reasons, I'd never present an AI sentiment trend to leadership without validating it against first-party sources — actual review platform ratings, support ticket themes, NPS movement — before treating it as an early warning worth acting on.
With that validation step included, persistent negative sentiment — repeated association with the same unresolved complaint or outdated claim across multiple runs — is a far more useful signal than a single bad week. If your sentiment trend is drifting negative while a competitor's is climbing, and that pattern holds up against your first-party data, it's worth flagging to leadership before it shows up as declining coverage or citation share, because it often precedes both.
How These AI Visibility Metrics Fit Together: A Tiered Dashboard
I've said track three metrics, then listed five. Here's how those fit together without contradicting each other.
Minimum viable AI visibility dashboard (the non-negotiable three):
- Query coverage percentage
- Position-weighted citation share
- Sentiment trend, validated against first-party data rather than treated as a raw AI classification
These three are the ones I'd insist on even with ten minutes a month. They answer, in order: are you in the conversation, how much does that presence count for, and is anything about to go wrong that hasn't shown up yet.
Expanded leadership dashboard (add once the three are stable):
- Share of voice versus your top two or three competitors — meaningful only once you have a coverage baseline to compare against, otherwise you're comparing noise to noise
- A composite visibility score — but only ever shown alongside its components (coverage, citation share, share of voice, sentiment), never as a standalone number. Treat it as a summary for a five-second glance, not a diagnostic tool. If it moves, the components tell you why; the score itself never should.
A simple decision rule for reading the three core AI visibility metrics together: if coverage is low, the priority is creating or expanding content that answers the comparison and problem-solving questions you're missing. If coverage is solid but citation position is weak, the priority shifts to authority and content clarity — clearer structure, stronger comparison content, better-credentialed claims. If both are stable but sentiment trend turns negative and first-party data confirms it, the priority becomes reputation work: review response, updated claims, and freshness fixes.
How to Build a Lightweight Monthly AI Visibility Dashboard
For leadership reporting, resist the temptation to show everything you're capable of measuring. Five numbers is the ceiling for a report someone will actually retain, and they should map to the tiered structure above:
- Query coverage percentage — tracked monthly, ideally with a confidence note on sample size
- Position-weighted citation share — your prominence indicator
- Sentiment trend — direction over time, validated against first-party sources rather than a single snapshot
- Share of voice versus your top two or three competitors
- Composite visibility score — shown with its components, never alone
On cadence: a weekly pulse check catches sudden competitor gains or sentiment spikes that a monthly-only cycle would miss until real damage is done. You don't need weekly leadership reporting — a monthly summary is usually the right rhythm for that audience — but the underlying data collection benefits from running more often than you report it.
Set a threshold for when a movement warrants investigation rather than just noting it. A coverage drop of more than five percentage points across repeated runs, for example, is worth digging into immediately rather than waiting for next month's number to confirm the trend.
When presenting to stakeholders, one chart per metric with a single sentence of context beats a dense spreadsheet. If you're doing this manually, expect it to take real time initially — running the same query set across four or five AI platforms by hand is genuinely tedious, and automating the query-running step is usually the first thing worth investing in once you've validated the method manually for a month or two.
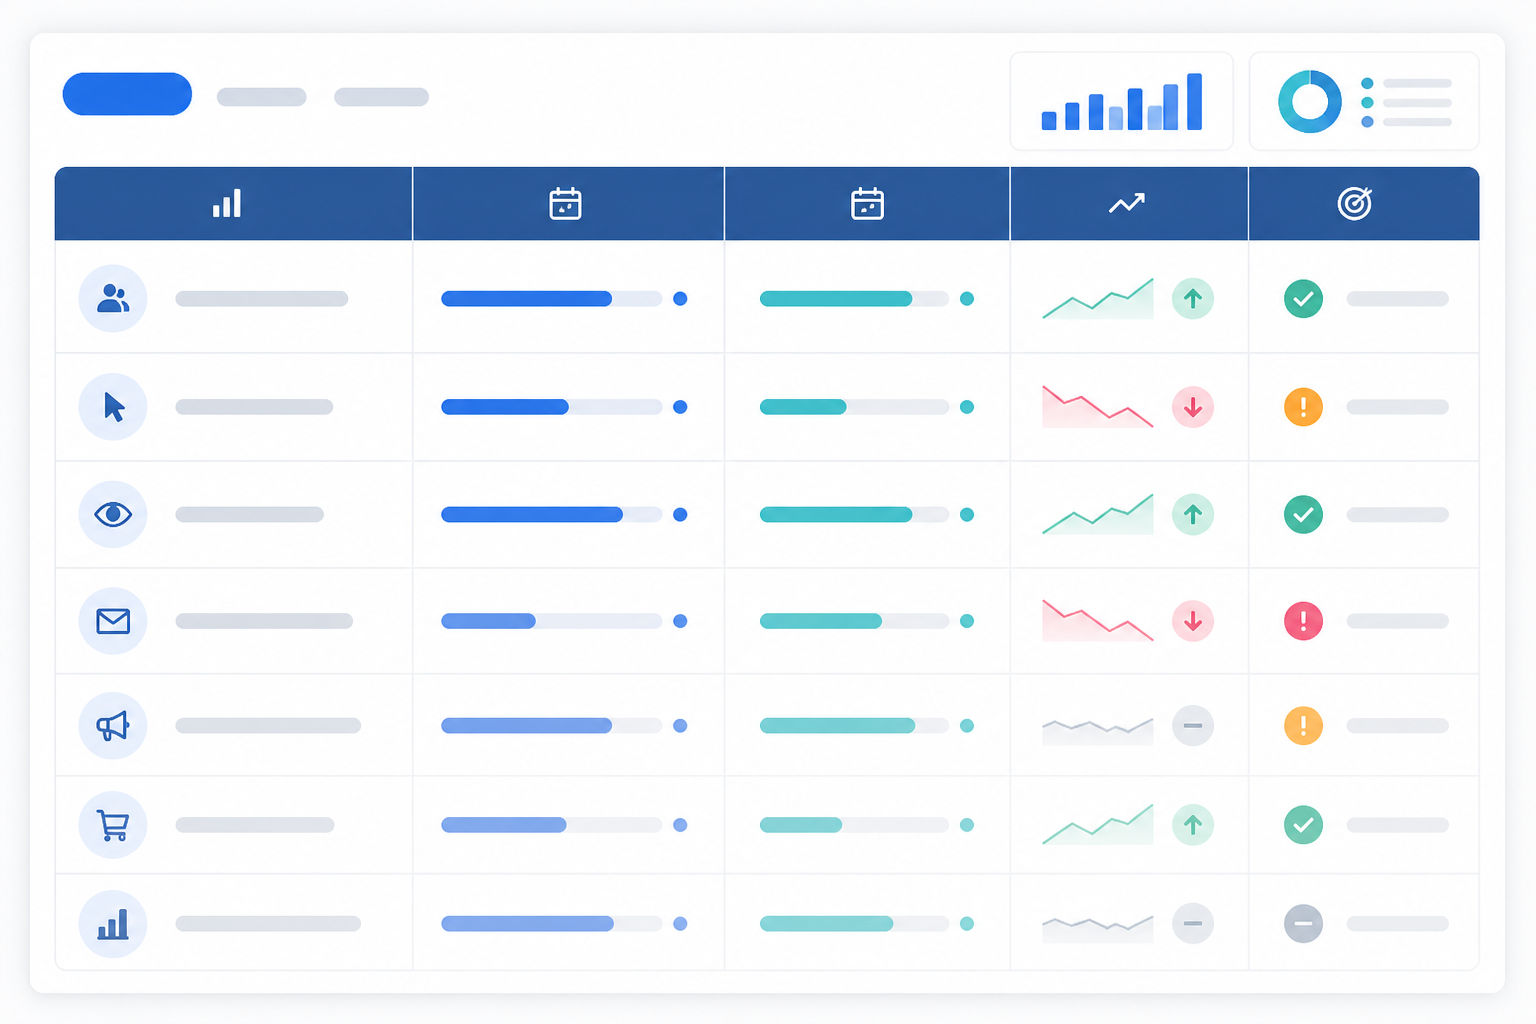
A simple template structure works well:
| Metric | This Month | Last Month | Trend | Action Needed |
|---|---|---|---|---|
| Query Coverage | 34% | 29% | ↑ | Expand comparison content |
| Citation Share (position-weighted) | 22% | 24% | ↓ | Review content clarity and structure |
| Sentiment Trend (validated) | Slightly positive | Neutral | ↑ | Monitor review response rate |
| Share of Voice | 18% | 17% | ↑ | Maintain current content cadence |
| Visibility Score (with components) | 61 | 57 | ↑ | No action, on track |
Which AI Visibility Metric Should You Prioritise With Limited Time?
If you've got one hour a month, here's the ranking again with the reasoning laid out plainly: query coverage first, because it tells you whether you're even in the conversation. Position-weighted citation share second, because it tells you how much that presence is actually worth — while remembering that citation "position" is a useful comparative signal, not a precisely standardised one across every AI platform. Sentiment trend third, because it's your earliest warning system for problems that haven't yet shown up in the first two — provided you've validated it against first-party data rather than trusting raw AI classification alone.
Share of voice matters, but I'd deliberately place it after these three. Comparing yourself to competitors only becomes meaningful once you have a stable coverage baseline.
The biggest mistake I see is metric paralysis: teams trying to track twelve numbers inconsistently rather than three numbers reliably. A consistent three-metric report, tracked monthly without fail, will serve leadership better than an ambitious twelve-metric dashboard that gets updated sporadically and abandoned by Q3. 📊
Frequently Asked Questions About AI Visibility Metrics
What's the actual difference between query coverage and citations?
Query coverage tells you whether your brand shows up at all when AI engines answer relevant customer questions — a yes/no presence metric across a set of queries. Citations go a level deeper: they describe how you're referenced within an answer that does mention you, including approximate position, frequency, and context. Think of coverage as "are you in the room" and citations as "how much airtime you get once you're there." Note that citation position isn't measured identically across every AI platform, so treat it as a directional, comparative signal rather than a precise universal ranking.
Which AI visibility metric best predicts real business impact?
Based on patterns observed across client monitoring data, position-weighted citation share tends to correlate most closely with consideration and follow-up engagement, because prominent citations plausibly influence whether someone clicks through or asks a follow-up question naming your brand. That's a directional finding from practical observation, not an independently peer-reviewed causal study, so I'd treat it as a strong working assumption rather than settled fact. It also only matters once you have decent query coverage — a well-positioned citation on a question nobody's asking won't move revenue.
How often should marketing teams update their AI visibility dashboard?
A weekly internal pulse check paired with a monthly summary for leadership tends to work well. AI engine answers can shift week to week as models update or competitors change their content, so monthly-only tracking risks missing sudden drops until they've already affected the metrics leadership cares about most. Several monitoring platforms now build weekly digests in for exactly this reason, though a manual weekly spot-check achieves the same goal for smaller teams.
Do I need technical resources to build an AI visibility dashboard myself?
Not necessarily. You can start with manual tracking: run 20–30 balanced customer questions through ChatGPT, Claude, Gemini, and Perplexity monthly, and log coverage, approximate position, and sentiment by hand against consistent rules. It's time-consuming but genuinely doable for a first pass, and it's the best way to understand the method before automating anything. Once the manual process is validated, automated monitoring platforms (I work with MentionOwl, though several exist) can remove the repetitive query-running and export data into existing BI tools via API — worth considering once you've outgrown a spreadsheet, not before.