How to Track Competitor Mentions Across AI Answer Engines: A Share of Voice Guide
A repeatable process for tracking competitor share of voice across ChatGPT, Claude, Gemini, Copilot and Perplexity, with reporting guidance for UK mar
How to Track Competitor Share of Voice and AI Visibility Across AI Answer Engines
To track competitor mentions across AI answer engines, build a fixed set of buyer-style questions and run them on a regular schedule (daily is a practical default) against ChatGPT, Claude, Gemini, Copilot and Perplexity. For every answer, record which brands are named, linked, cited and recommended, and in what order. Calculate share of voice as your brand's portion of all tracked-brand appearances, weighted by position, and trend it over weeks instead of relying on one-off spot checks. That gives marketing teams a repeatable way to measure AI visibility across engines. AI answers can vary from run to run, so manual sampling rarely produces numbers a leadership team will trust. Automation is worth paying for.
Here is what the output looks like. Take the prompt 'What is the best payroll software for a UK small business?'. Suppose a captured ChatGPT answer names three brands and yours is second. Your brand counts once towards mention share, and under a 1/position weighting it scores 0.5 for that answer. Repeat that across dozens of prompts, engines and runs, and you have a defensible trend line instead of a flattering screenshot. 📊
The rest of this guide covers which questions to test, how to code and calculate the metrics so they survive scrutiny in a leadership review, how to compare and blend engines, how to spot threats early, and what to do when a rival is winning. I wrote it for UK marketing teams who need AI visibility data they can defend. All worked numbers below are illustrative, not market benchmarks.
Why AI Search Makes Competitor Share of Voice Different
Traditional share of voice rested on fairly stable foundations: rankings, impressions and paid media spend. A keyword ranked third on Monday was usually ranked third on Tuesday. AI answers are less predictable. They are generated in response to each query and often draw on live retrieval, so the same question can return different brands on different days. A measurement approach that assumes stability will give you misleading results.
There is also a structural difference. A results page offers ten blue links, while an AI answer compresses that page into a single response with far fewer slots. A brand may be named, linked, cited as a source, or absent, and the gap between those states matters commercially.
Track AI mentions, links, citations and recommendations separately
These outcomes overlap, so I record them as independent fields on every answer instead of as mutually exclusive buckets:
- Brand named: yes or no. The brand appears in the answer text.
- Brand linked: yes or no. The answer links to your site.
- Domain cited: yes or no. A page on your domain appears among the listed sources.
- Position: the order in which the brand first appears in the recommendation or list (1, 2, 3 and so on).
- Role: recommended option, alternative, category example, caution or cited source only.
- Sentiment: positive, neutral or cautionary.
A single answer can satisfy several fields at once. A 'hard mention' is simply named plus linked, a 'soft mention' is named but not linked, and a 'citation-only' appearance is a cited domain with no name in the text. Google's documentation on AI features in Search and OpenAI's bot documentation both describe experiences where sources are surfaced separately from the generated text. That is why tracking these fields separately keeps you from overstating your visibility.
Each engine also draws on different sources and retrieval methods, so strong performance in one does not reliably predict performance in another. The shift is not small. Gartner forecast in February 2024 that traditional search engine volume would fall 25% by 2026 as users move towards AI chatbots and virtual agents. That is a forecast and not a measured outcome, but it explains why leadership teams are asking the question.
Click data shows that AI visibility and traffic are separate things. Pew Research Center's analysis of Google searches by US adults covered 68,879 searches in March 2025 and found AI summaries on about 18% of the searches examined. Users clicked a traditional result in 8% of visits when a summary appeared, against 15% when none did, and clicked a link inside the summary in just 1% of visits. SparkToro and Datos found something similar: 58.5% of US and 59.7% of EU Google searches in their 2024 study ended without a click to the open web. These are Google-specific figures from single study periods, not UK rates or universal constants. They do show why presence in the answer has to be measured independently of referral clicks.
This is why one-off checks mislead. A single screenshot of a favourable answer is an anecdote, not a measurement. If you treat this as part of generative engine optimization and AI SEO, you need the same discipline for visibility that you apply to content changes. If you cannot measure movement reliably, you cannot know whether your optimisation work is doing anything.
Questions to Track Competitor Share of Voice and Positioning
Most teams ask first which prompts to test. You want a balanced set that mirrors how real buyers phrase their needs at every funnel stage, including specific buying situations and not only broad category prompts. Using payroll software as a worked category, a UK-specific starter set looks like this:
| Question type | Example prompt (illustrative) | What it reveals |
|---|---|---|
| Category discovery | 'What is the best payroll software for a UK small business with under 20 employees?' | Unbranded visibility and brand lists |
| Price-led | 'Which payroll software costs under £15 a month for a UK limited company?' | Whether pricing in pounds changes who is named |
| Direct comparison | '[Brand A] vs [Brand B] for UK payroll and auto-enrolment pensions' | How each brand is characterised |
| Alternatives | 'Alternatives to [Competitor] that support HMRC Real Time Information' | Who is positioned as the substitute |
| Compliance | 'Which payroll software stores data in the UK and complies with UK GDPR?' | Trust and regional suitability |
| Trust and review | 'Is [Brand] reliable for P45 and P60 processing? What do UK customers say?' | Sentiment and reputational framing |
Swap in your own sector's regulatory and commercial vocabulary. That might be Making Tax Digital for accountancy tools, FCA rules for financial products, or NHS procurement language for health technology.
How many questions should you test?
I treat 30 to 100 prompts as a starting heuristic, not a research-backed threshold. The reasoning is arithmetic, not empirical. Below roughly 30, a few outlier answers can swing your share of voice figure noticeably. Above 100, the set gets hard to review and maintain. I am not aware of rigorous published guidance on how much phrasing variation alters brand lists, so I would not quote a universal number.
To choose a point within the range, stratify by funnel stage and business priority. A 40-prompt panel might allocate 12 to category discovery, 10 to comparisons, 8 to alternatives, 6 to problem-led and compliance questions, and 4 to trust questions, with extra weight on the products that matter most commercially. Generate candidate prompts from your own site content, sales-call notes and support tickets. Teams writing prompts by hand tend to use their own product vocabulary, which flatters their position. Some monitoring platforms automate the site-content step, but whichever route you use, add the unbranded and competitor-led prompts yourself.
Keep branded and unbranded AI visibility separate
Branded queries inflate share of voice. If your brand is in the question, it will almost always be in the answer, and that hides weakness in unbranded discovery, where new customers are found. In the worked example below, the same brand that appears in 42% of unbranded answers could appear in nearly 100% of branded ones. Report the two separately and treat the unbranded figure as the honest indicator.
Record the testing context for every run
Location and account state can change answers, so log them with every run. That means the market (UK), language (en-GB), the location the request appears to come from, whether the session was logged in, whether web search was enabled, the engine and model version where shown, and the date. If you serve regional audiences, test from a small number of UK locations and compare them before assuming one result represents the whole market. A colleague testing from a different locale and seeing different brands is a documentation problem before it is a data problem.
How to Measure AI Share of Voice: Metrics That Hold Up in a Leadership Review
Before reporting anything, define your denominator. Two different calculations often get conflated. One is the share of tested answers that mention a brand (query coverage, a measure of breadth). The other is a brand's share of all tracked-brand appearances (mention share, a measure of relative presence). Both are legitimate, but they answer different questions, so your report should say which one it uses.
Coding rules for repeatable share of voice reporting
These rules make the numbers reproducible:
- Count unique brand appearances. A brand named five times in one answer counts once for that answer. The mention-share denominator is the total of unique tracked-brand appearances across all answers.
- Keep citation share separate. A cited domain counts once per answer. Citation share is a brand's cited answers divided by all tracked-brand citations. If a brand is both named and cited in one answer, it counts in both metrics, but I never add the two together.
- Define position by order of first appearance in the recommendation or list.
- Apply a documented position weight. I use weight = 1 ÷ position (1.0, 0.5, 0.33, 0.25 and so on). Any declining scheme is defensible if you publish it and hold it constant.
- Average repeated runs at prompt level first. Calculate each prompt's metric across its runs, then average across prompts, so every prompt carries equal weight.
- Code sentiment and role, and report them alongside the figures. A cautionary mention adds volume but not value.
Worked example: calculating share of voice and AI visibility
Imagine four unbranded prompts, each run three times on one engine, giving 12 answers, with three tracked brands.
| Metric | Your brand | Competitor B | Competitor C |
|---|---|---|---|
| Answers naming the brand (of 12) | 5 | 8 | 4 |
| Query coverage | 41.7% | 66.7% | 33.3% |
| Mention share (17 unique appearances) | 29.4% | 47.1% | 23.5% |
| Positions across appearances | 1, 2, 3, 1, 4 | 1, 1, 2, 1, 3, 2, 1, 2 | 2, 3, 4, 3 |
| Sum of position weights | 3.08 | 5.83 | 1.42 |
| Position-weighted share (total 10.33) | 29.8% | 56.5% | 13.7% |
| Answers citing the brand's domain | 3 | 6 | 2 |
| Citation share (11 citations) | 27.3% | 54.5% | 18.2% |
Two things stand out. Your raw mention share of 29.4% looks respectable, but Competitor B's weighted lead (56.5%) is wider than its raw lead (47.1%) because B is usually named first. And your brand is cited in three answers, two of which also name it, so one answer used your page without crediting you by name. A flat headline number would have hidden both findings.
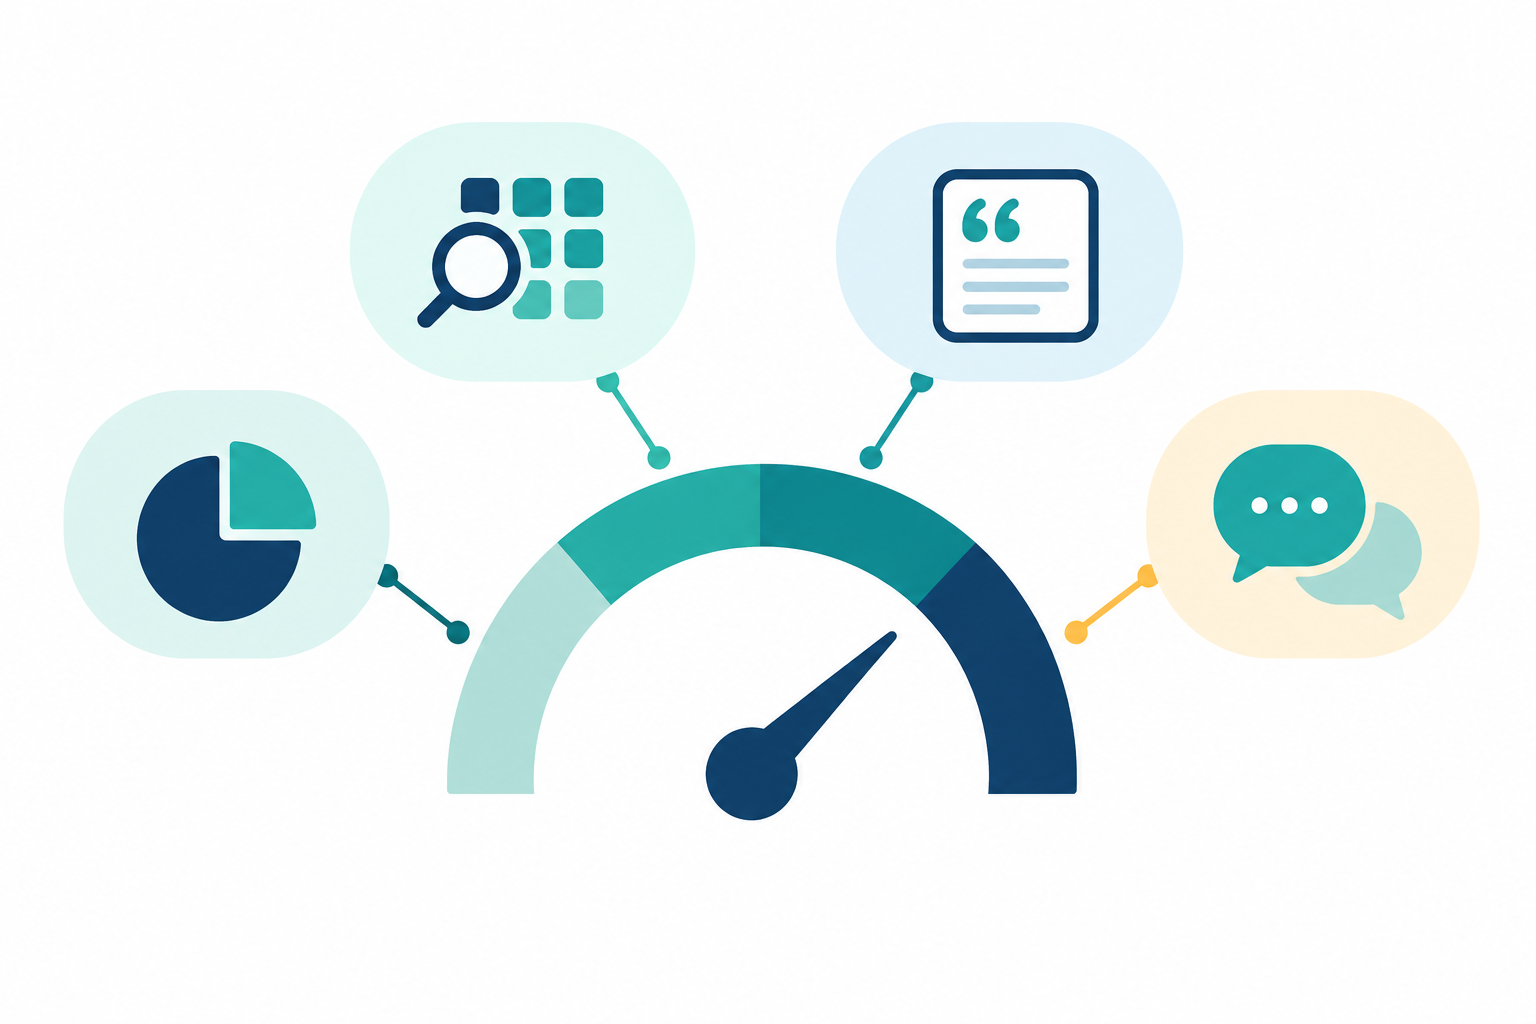
Optional composite AI visibility score
A composite helps leadership take in several metrics at once. An illustrative index might combine query coverage (30%), position-weighted citations (30%), share of voice (25%) and soft mentions (15%) into a 0-100 score. Those weights are an example, not a standard. Whichever tool you use, if you combine metrics into a weighted index you must disclose the formula and keep the component metrics. A black-box number invites exactly the challenge you are trying to avoid.
Report context alongside share of voice
A credible scorecard states the number of prompts tested, the runs per prompt, the engines covered, the date range, the market and the intent mix, and shows branded and unbranded results separately. The table above is the model to follow: raw counts first, derived percentages second.
How many runs do you need for reliable results?
Answers vary, so a single run per question is a sample of one. I am not aware of a rigorous published benchmark for the number of runs that guarantees stability, and it will differ by category, so I recommend measuring it yourself. During a four-week baseline, keep the prompt set fixed, record weekly share of voice, and calculate its standard deviation. That figure is your noise floor. Movements well beyond it, with no changes on your side, are candidates for real signal, and movements inside it are not. Daily runs help by supplying more samples, but frequency alone does not prove statistical sufficiency.
One more caution on sources. Google Search Console includes AI feature traffic within overall Web search reporting and not as a separate series, so it cannot serve as an AI share of voice report. Microsoft's AI Performance report in Bing Webmaster Tools offers a native view of citations, cited pages and grounding queries (the searches an AI system runs to find material to base its answer on) across Microsoft AI experiences. Use reports like these to complement a consistent cross-engine prompt panel, never to replace it.
How to Compare Share of Voice Across AI Engines
Raw counts across engines are not directly comparable, because features and reporting coverage differ. Compare within the same prompt set and reporting period, and report mention share and citation share separately. The table below lists what to verify, not conclusions to accept. Engine behaviour changes often, so treat each entry as a tendency to validate against your own captured answers, and date your observations when you do.
| Engine | Citation display | Web retrieval | What to check in your captured answers |
|---|---|---|---|
| ChatGPT | Sources shown when search is used | Used for some queries, not all | Share of answers with sources attached; whether search was enabled |
| Claude | Depends on whether web search is in use | Varies by configuration | Whether answers name brands or only give selection criteria |
| Gemini | Supporting links in Google AI features | Draws on Google's search ecosystem | Overlap between cited pages and pages ranking in Google |
| Copilot | Citations across Microsoft AI experiences | Integrated with Bing | Overlap with Bing-indexed pages; Bing Webmaster Tools data |
| Perplexity | Sources displayed prominently | Heavy | Which review, forum and comparison pages are cited repeatedly |
Report share of voice by engine and as a blended figure
Report share of voice for each engine and as a blended figure. An aggregate can hide a collapse on one platform. It can equally hide a competitor dominating a high-value prompt class, such as comparisons, while appearing less often overall.
To blend, calculate share of voice within each engine first, then take a weighted average, using weights that reflect where your audience actually searches. Your own web analytics, filtered for AI referrers, can show which engines send visits to your site. Referral traffic captures only click-throughs, not all the influence an answer has, so use it as a weighting input and not a complete picture, and state the weights in your report. Never pool raw mention counts across engines, because an engine that names more brands per answer would dominate the total.
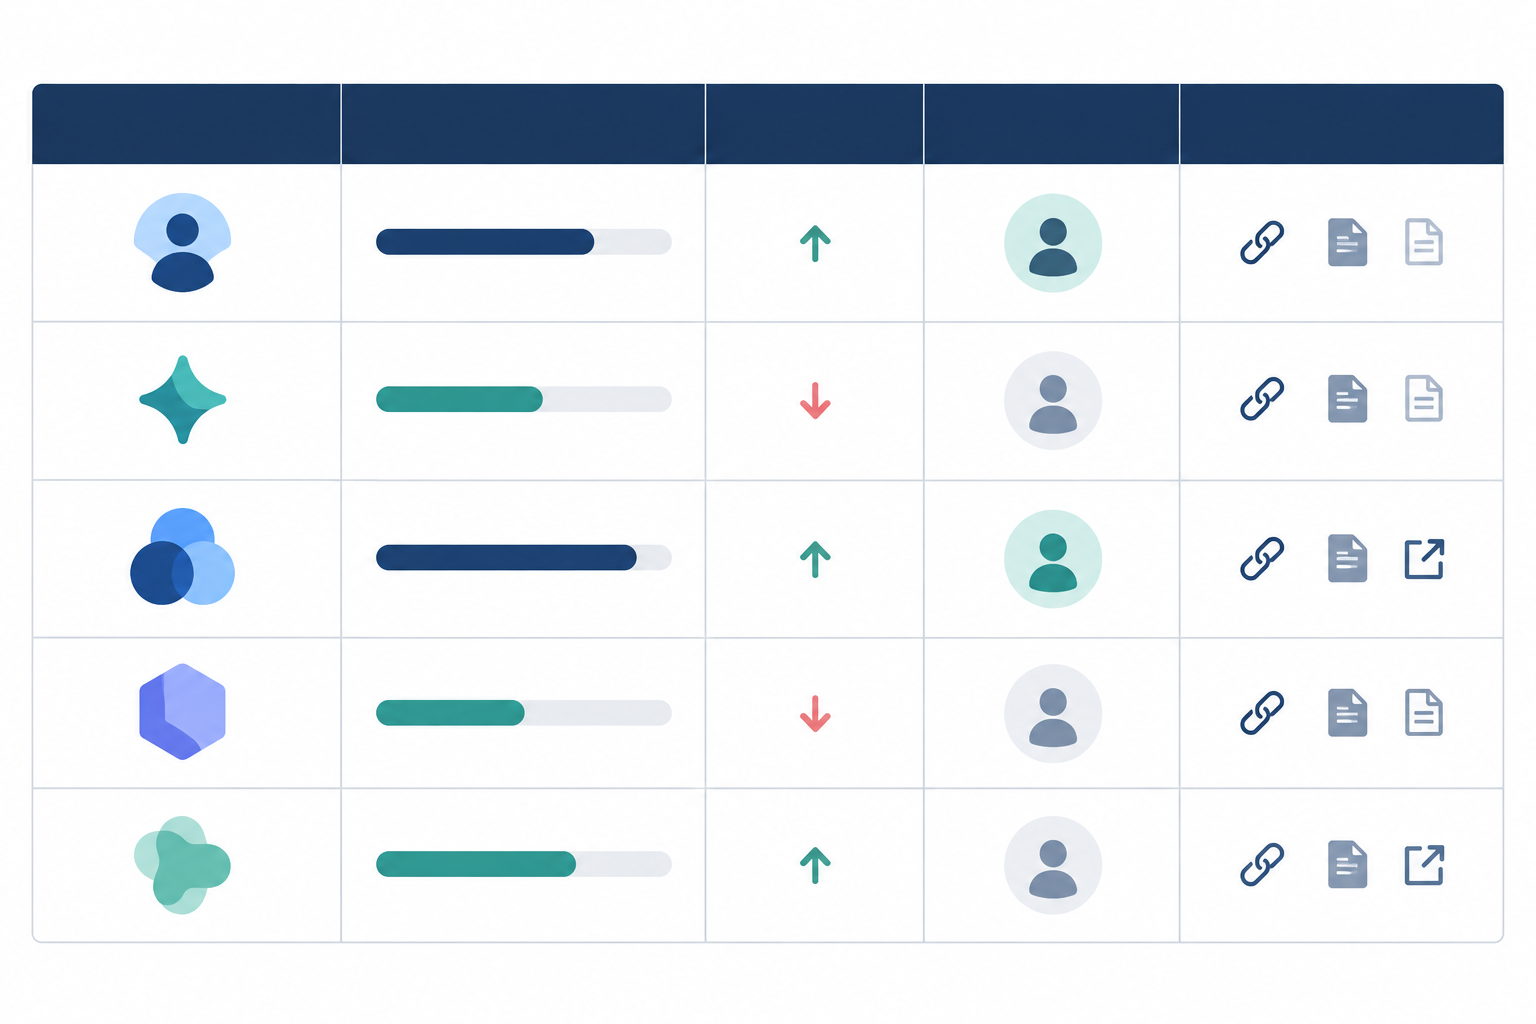
The summary below is illustrative, with invented figures and engine weights of 40/10/20/10/20 per cent. The blended share of voice is 0.4×24 + 0.1×18 + 0.2×27 + 0.1×21 + 0.2×33 = 25.5%.
| Engine | Weight | Share of voice | Change vs prior month | Top competitor | Citation behaviour (citation share) |
|---|---|---|---|---|---|
| ChatGPT | 40% | 24% | +2 pts | Competitor A | 19% |
| Claude | 10% | 18% | -1 pt | Competitor B | 12% |
| Gemini | 20% | 27% | +4 pts | Competitor A | 22% |
| Copilot | 10% | 21% | 0 pts | Competitor C | 17% |
| Perplexity | 20% | 33% | +3 pts | Competitor A | 38% |
| Blended | 100% | 25.5% | +2.1 pts | Competitor A | 22.5% |
Interpret differences in AI visibility between engines
Differences between engines tell you something. In the illustrative data, Perplexity shows the highest citation share (38%), but ChatGPT, the most heavily weighted engine, shows a much lower one (19%). One hypothesis is that your content is retrievable but third-party coverage, which shapes how models characterise you, is thin. The reverse, named often but rarely cited, may suggest models know your brand but your pages are not structured to be quoted. Treat both as hypotheses to test, not conclusions.
How to Spot Emerging Competitor Threats in AI Answers
Competitor tracking earns its keep when it warns you before a rival's gains show up in revenue. These are the signals I monitor:
- New entrants: brands appearing in category discovery answers, often before they register in traditional SEO tools.
- Week-on-week movement: changes beyond your baseline noise floor, as described above.
- Changes in description: a competitor moving from 'budget option' to 'best overall' signals repositioning, and it often precedes a share gain.
- Source patterns: where competitors are being cited, whether on review sites, comparison articles or forum threads. Those sources are the levers behind their gains.
- Weekly digests: these surface change without anyone having to read raw answers daily.
Set share of voice alert thresholds
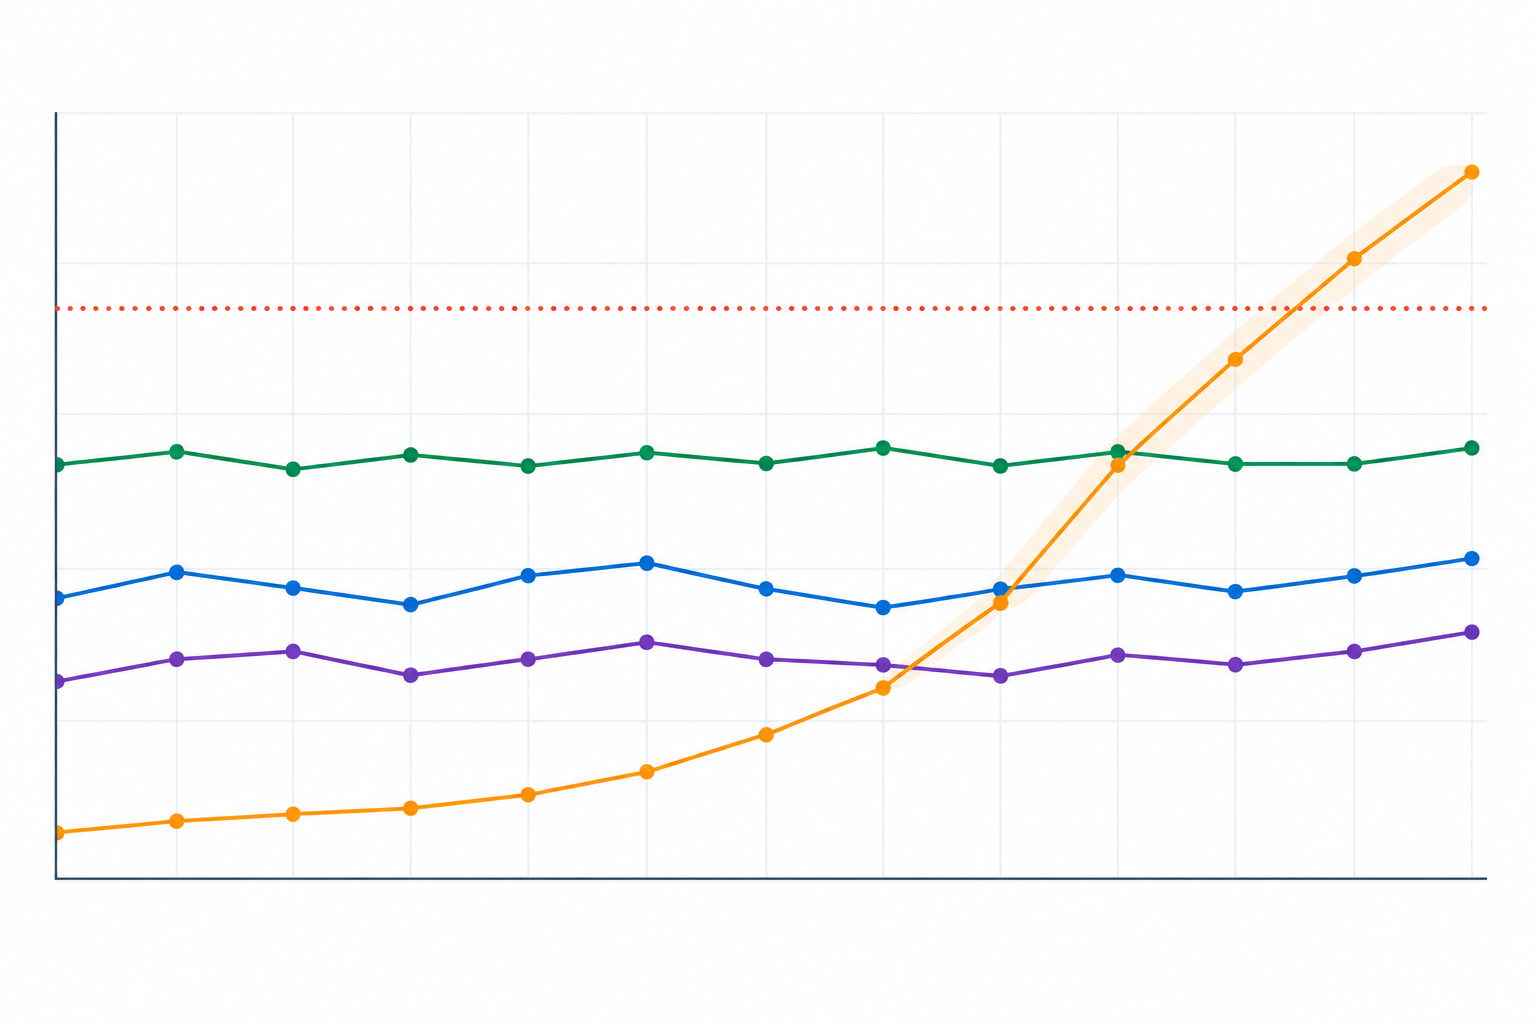
Thresholds should be configurable, not fixed. A reasonable starting rule is to alert when a competitor's weekly share of voice moves by more than two standard deviations of its baseline variation, then adjust for business materiality. If your baseline standard deviation is 1.5 points, a 3-point move is worth a look. A team in a volatile category may need a wider band, and one in a stable category may want a tighter one. Pair the statistical test with a commercial one: a 3-point gain on a prompt class that drives most of your pipeline matters more than 5 points on a peripheral one.
Separate AI answer noise from real competitor movement
Answers vary, so a single-day spike proves little. I wait for movement to persist across multiple runs and, ideally, to show up on more than one engine before escalating. A competitor that jumps on one engine for one day is probably noise. One that rises across several engines over several weeks is a trend that deserves attention.
What to Do When a Competitor Dominates AI Answers
Domination is rarely uniform, so respond methodically and not reactively.
- Diagnose first. Identify which questions, engines and sources drive the competitor's lead. A lead concentrated in comparison prompts on two engines demands a different response from a blanket gap.
- Run an AI legibility audit. Check whether engines can crawl and parse your offering: crawl access, structured data, clear entity information and readable page structure. OpenAI distinguishes OAI-SearchBot, used for search, from GPTBot, used for training, so verify your robots.txt rules allow the crawler you intend.
- Close content gaps. Create pages that directly answer the questions where the competitor wins, using clear, quotable, evidence-backed statements.
- Build third-party presence. Earn coverage in the sources engines already cite, such as reviews, industry publications and comparison lists.
- Refresh and consolidate outdated pages. Stale information can lead engines to prefer a competitor's more current material.
- Re-measure over several weeks. Report the movement in share of voice, and be honest that shifts in AI answers are gradual and not guaranteed.
Here is a short scenario. Your weekly data shows Competitor B gaining on 'alternatives to' prompts across ChatGPT and Perplexity, and Perplexity cites the same two UK comparison articles in most of those answers. That points to a source gap and not a site problem. The action is to pursue coverage in those articles, publish a clear comparison page of your own, and re-measure the same prompts for four to six weeks. I think of generative engine optimization as an iterative loop of diagnosis, action and measurement. It is not a one-time fix.
How to Build a Repeatable AI Share of Voice Tracking Process
A repeatable process is what turns scattered checks into evidence leadership can rely on. This is the sequence I recommend.
- Define your competitor set. Include direct rivals, adjacent alternatives and aspirational brands, and keep it stable enough to trend.
- Build and lock the question set. Use the stratified approach above. Review it quarterly and not weekly, and mark any added or retired prompts instead of silently changing the denominator.
- Choose a cadence. Daily automated runs are a practical default. Report weekly and summarise monthly or quarterly for leadership.
- Record consistently. Capture the fields and testing context defined earlier, plus the full answer text and cited URLs, so any figure can be audited.
- Establish baselines and targets. For example, set a share of voice goal against your top two competitors after four weeks of baseline data.
- Automate across engines. Doing this by hand across five engines is impractical at scale (see the tooling note below).
- Package results for leadership. Use a one-page view covering visibility score or share of voice by engine, competitor movement, key risks and actions taken.

How often should competitor tracking be updated?
- Daily: automated runs, with no human review required.
- Weekly: digest review, checking alert thresholds and competitor movement.
- Monthly: share of voice by engine, change versus prior period, actions taken.
- Quarterly: question set review, competitor set review, target reset and leadership summary.
For UK stakeholders, state the market in every report, use pounds in pricing prompts, and name the UK-specific constraints your category faces. That way a colleague testing from a different locale can see why their results differ.
Choose AI visibility tracking tools carefully
I work on MentionOwl, one of the platforms in this category, so weigh this note accordingly. Whatever you choose, look for scheduled runs across ChatGPT, Claude, Gemini, Copilot and Perplexity, storage of full answer text and cited URLs, a disclosed scoring formula, and data export. MentionOwl offers these, plus a REST API for feeding BI dashboards and an MCP server (Model Context Protocol, a standard that lets AI assistants query external data sources directly). It also has a seven-day trial from $1. That is a commercial offer, so check current terms on its site. A spreadsheet and a disciplined weekly routine are still a valid way to prototype the method on a small prompt set before you commit to any platform.
Frequently Asked Questions About AI Share of Voice
Which questions should I test to see competitor mentions?
Start with a balanced set covering category discovery, direct comparisons, 'alternatives to' queries, price-led and compliance questions, and trust questions, phrased the way UK buyers phrase them. Include both branded and unbranded prompts, and treat 30 to 100 prompts as a starting range, stratified by funnel stage and business priority.
How often should competitor tracking be updated?
Run the question set daily where possible, report weekly, and review monthly or quarterly. Keep the prompts fixed between reviews so movements reflect real change, and use a four-week baseline to learn how much your own numbers fluctuate before setting alerts.
What do I do if a competitor is dominating AI answers?
Find out exactly which questions, engines and cited sources explain the lead. Then audit your site's AI legibility, fill content gaps and strengthen your presence in the third-party sources engines already cite. Measure over several weeks, since changes in AI answers are typically gradual.
Can I automate this across all major AI engines?
Yes. Several monitoring platforms run a fixed question set on a schedule against ChatGPT, Claude, Gemini, Copilot and Perplexity and record answers, citations, sentiment and competitor mentions. Check that the tool shows its formulas, stores raw answers and exports data, so your reporting stays auditable.
Is share of voice in AI search the same as in traditional SEO?
No. Traditional share of voice is usually based on rankings and estimated traffic. AI share of voice measures how often and how prominently brands are named, cited or recommended within generated answers. That makes explicit coding rules, position weighting and repeated sampling essential.