How to Track If AI Assistants Recommend You Over Competitors (A DIY Guide for UK Small Businesses)
Learn how to measure share of voice across AI answers, compare local competitors, and know when manual checks should give way to automation.

AI Share of Voice: A DIY Method for UK Small Businesses (Plus When to Automate)
AI share of voice is the percentage of relevant AI-generated answers that mention your business, measured against how often your closest competitors are mentioned for the same queries. You can start measuring it today without software: ask ChatGPT, Gemini and Perplexity the same questions your customers would ask, then record whether you are mentioned, where you appear in the response, and how you are described compared with competitors.
This manual approach works well at a small scale. However, through running these tests myself, I have found that it becomes difficult to manage once you are tracking more than a handful of queries across multiple platforms on a recurring basis. That is where automated AI share of voice tracking becomes useful.
This guide explains the manual method first, with a worked example and a reproducible formula, so UK small business owners can understand the mechanics before paying for automation. It then shows, with real numbers, where manual AI visibility testing stops scaling.
Why AI Share of Voice Matters for UK Small Businesses
AI assistants have moved well beyond returning a list of links. OpenAI's documentation on ChatGPT search describes a shift towards assistants that name businesses directly, build shortlists and describe them in prose rather than deferring to a ranked page of results 🦉. Google has made a similar point about AI Overviews: the assistant synthesises information from multiple sources, pulls from business directories and Maps data, and can produce a different answer depending on wording, location and even the date the question is asked.
This matters because AI recommendation visibility works differently from traditional search ranking. There is no page one that you can screenshot and defend indefinitely. Every time someone asks, “What is the best accountant for a small business in Manchester?”, the model generates a fresh answer, drawing on whatever combination of your website, Google Business Profile, reviews and third-party directories it can find and trust at that moment.
The commercial signals here are worth taking seriously, although they need careful framing. Adobe Analytics reported that traffic from generative AI sources to US retail websites rose sharply during the 2024 holiday shopping period compared with the previous year, and that AI-referred visitors browsed more pages and bounced less often than visitors arriving from other channels. That is a US retail dataset from a specific six-week window, so I would caution against assuming identical multipliers for a UK plumbing firm or dental practice. I have not found an equivalent UK local-services study, and I think that gap should be stated plainly rather than papered over. What the data does support is a direction of travel: a growing share of decision-stage research is happening inside a chat window rather than on a conventional results page.
Separately, Pew Research Center's 2025 analysis of Google search behaviour found that when a search included an AI-generated summary, users clicked a traditional search result far less often than when no summary appeared, and clicked a link inside the AI summary only rarely. I would read this as evidence that being represented inside an AI answer is becoming at least as important as being clicked, rather than proof that clicks have vanished entirely. If a competitor is consistently named and you are not, some of that influence may never appear as attributable referral traffic in your analytics because there is no click to trace. That gap is exactly what AI share of voice monitoring is designed to help measure.
What Questions Do Customers Ask AI About Your Industry?
Before you can measure AI share of voice, you need a realistic query list. Do not start with your business name. Start with the decision-stage language customers actually use, and split it into three types so your comparison is not biased towards searches that already contain your name:
- Non-branded discovery questions: “best [service] in [town]”, “[service] near me open now”, “cheapest [service] in [area]”
- Branded questions: “is [your business] any good?”, “[your business] reviews”, “is [your business] reliable for emergency call-outs?”
- Competitor and comparison questions: “[your business] vs [competitor]”, “is [competitor] better than [your business] for [use case]?”
The best source material is not your own guesswork; it is your Google reviews, customer emails and sales call transcripts. Customers rarely phrase things the way business owners expect. A UK independent electrician should test something broad, such as “best electrician in Bristol for an emergency call-out”, alongside something specific, such as “which Bristol electricians offer transparent pricing?” A dentist in Leeds should test both “best dentist in Leeds” and a narrower variant such as “dentist that does emergency appointments in Leeds”. I have consistently seen AI models respond differently to specificity, sometimes naming an entirely different shortlist depending on how granular the question is. A starter list of 10–15 queries, split across the three categories above, is enough to begin.
How to Manually Test AI Share of Voice Yourself
Once you have your query list, the testing process is straightforward, if a little tedious. Here is the method I use, with the controls I have learned to apply after seeing how much noise inconsistent testing can introduce.
- Open each platform in a separate tab. ChatGPT, Gemini, Claude, Copilot and Perplexity use different training data and live retrieval sources, so their answers can genuinely diverge. Testing only one platform gives you a partial picture of your AI visibility.
- Ask the question naturally, using a fresh or incognito session where possible. Incognito mode reduces personalisation, but it does not eliminate every source of variation. Model version, location signals and whether web search is enabled can still change the answer.
- Record the exact test conditions alongside the response: country, town or postcode used in the prompt, platform mode (search-enabled or not), model name if the interface shows one, logged-in status, device and browser, and the exact date and time. Without this information, you cannot tell whether a change in the answer reflects a genuine shift or simply a different starting condition.
- Record the full response verbatim, not just whether you appear, and save any citations or source links shown. Tone and framing matter almost as much as inclusion; being described as having “mixed reviews” is a very different outcome from being called “highly rated and reliable”, even if both technically count as a mention.
- Note your position in the response — named first, buried in paragraph three, or only referenced in passing.
- Repeat the same query two or three times across different days, treating each run as one sample rather than a definitive ranking. I have seen answers shift from week to week with no change to the business's website or listings.
- Log everything in a spreadsheet: query, category (branded, non-branded or competitor), platform, date, location used, mentioned (yes/no), position, competitors named, sentiment and citation present (yes/no).
Here is what five logged rows might look like in practice:
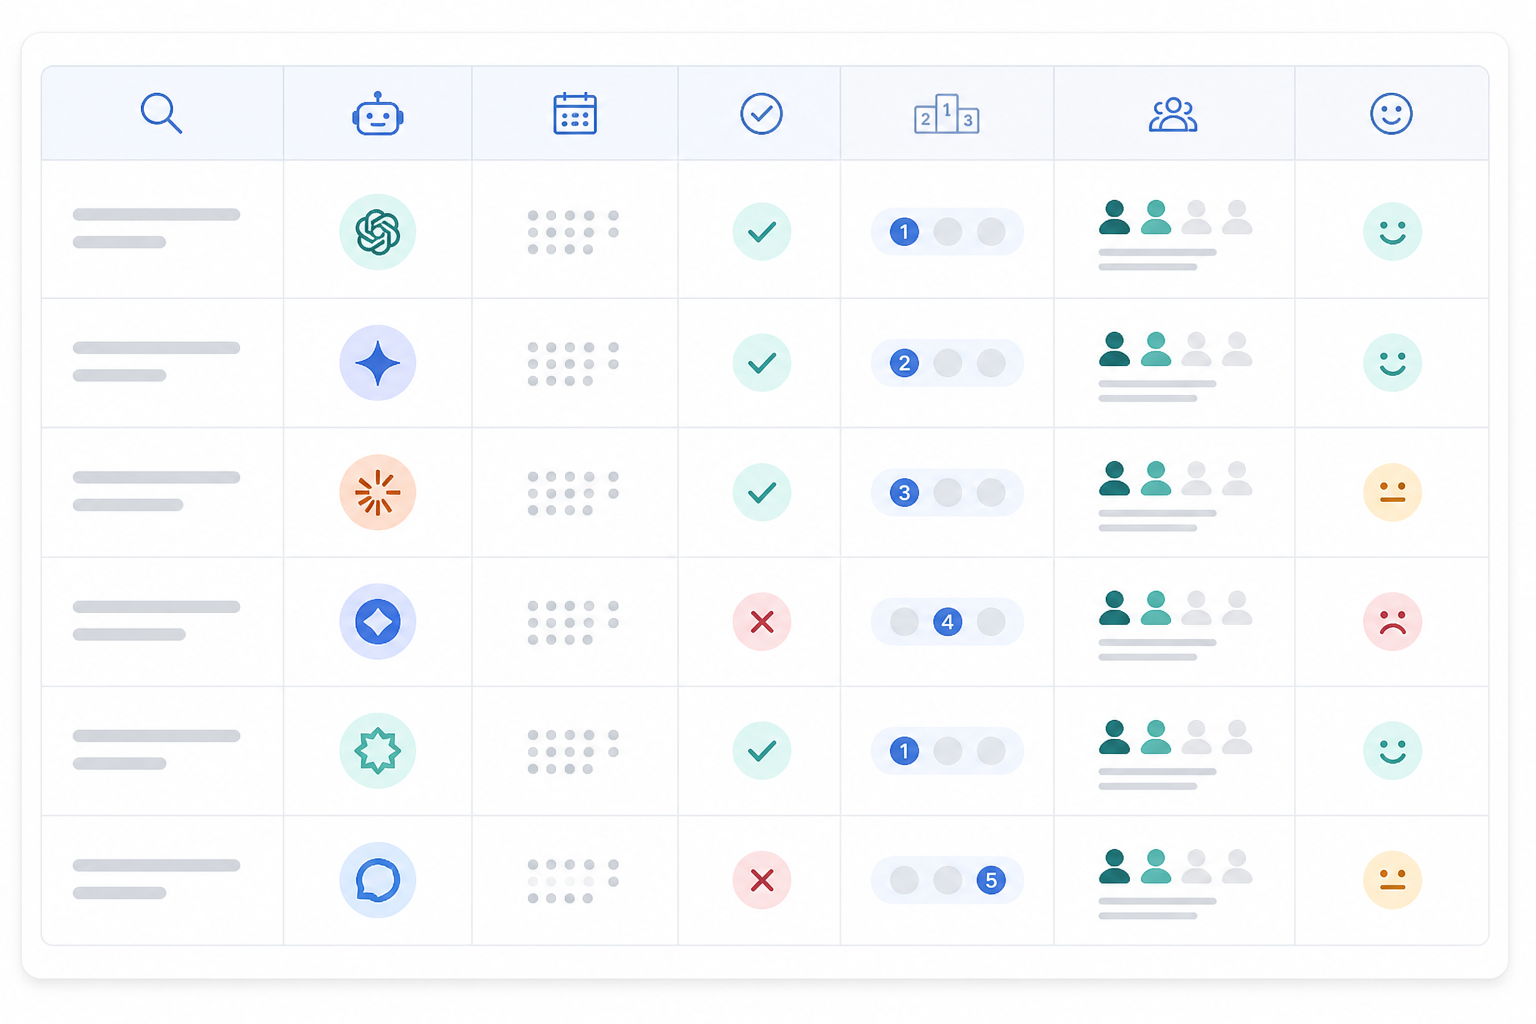
| Query | Platform | Date | Your position | Top competitor named | Sentiment | Citation? |
|---|---|---|---|---|---|---|
| “best electrician in Bristol” | ChatGPT | 12 Feb | 2nd | Competitor A (1st) | Positive | Yes |
| “best electrician in Bristol” | Perplexity | 12 Feb | Not mentioned | Competitor A (1st), Competitor B (2nd) | — | No |
| “electrician for emergency call-out Bristol” | Gemini | 13 Feb | 1st | Competitor B (2nd) | Positive | Yes |
| “is [you] reliable” | ChatGPT | 14 Feb | Mentioned, no ranking | — | Mixed reviews | Yes |
| “[you] vs Competitor A” | ChatGPT | 14 Feb | 2nd | Competitor A (1st) | Positive | Yes |
Five rows will not tell you much on their own, but this is the raw material every later calculation depends on. Getting the conditions and wording consistent matters more than the volume of queries at this stage.
How to Calculate AI Share of Voice
Once you have logged a few weeks of data, five dimensions matter more than any single response:
- Mentions: are you named at all, and how consistently across repeated versions of the same query? A single favourable mention tells you little; consistency across five or six repeats tells you considerably more.
- Position: it is reasonable to expect that businesses named first in an AI response receive more attention, similar to how top search results dominate attention in traditional search. However, I have not seen a rigorous published study measuring this specifically for AI answers, so treat it as a plausible working assumption rather than a proven multiplier. Track it anyway, because it is inexpensive to record and likely to matter.
- Sentiment: is the AI using confident language — “reliable”, “well-reviewed”, “established” — or hedging with phrases such as “mixed reviews” or “limited information available”? Treat sentiment as an observed description in that specific response, not a reliable read on the model's overall opinion of your business.
- Soft mentions: these are cases where you are implied or partially referenced without a full citation. Manual tracking almost always misses them because they are easy to skim past, but they matter for a complete picture.
- Share of voice: this is the metric that ties the others together.
AI Share of Voice Formula
The formula I use is simple:
AI share of voice = (your tracked mentions ÷ total tracked mentions across you and your competitors for the same queries) × 100
A few counting rules make the calculation reproducible:
- Count each qualifying response once per business, regardless of how many times that business is named within a single answer.
- Treat a non-mention as zero rather than excluding the query from the total.
- Weight every query equally unless you have a specific reason to give high-value queries more weight.
Worked AI Share of Voice Example
Say you tracked 20 queries across five platforms over one week — 100 total runs. Your business appeared in 42 of those responses. Your three closest competitors combined appeared in 58 responses across the same set. Your share of voice is:
42 ÷ (42 + 58) × 100 = 42%
That single number, tracked over successive weeks, tells you more about competitive standing than any individual response because it accounts for your visibility and your competitors' visibility simultaneously.
It is also worth segmenting your results by place and service rather than looking at one national average. A business might be well represented for one town and effectively invisible for a neighbouring one, or strong for one service category while absent for another. Averaging across everything can conceal the local gaps you most need to fix.
Why Manual AI Visibility Checking Breaks Down Over Time
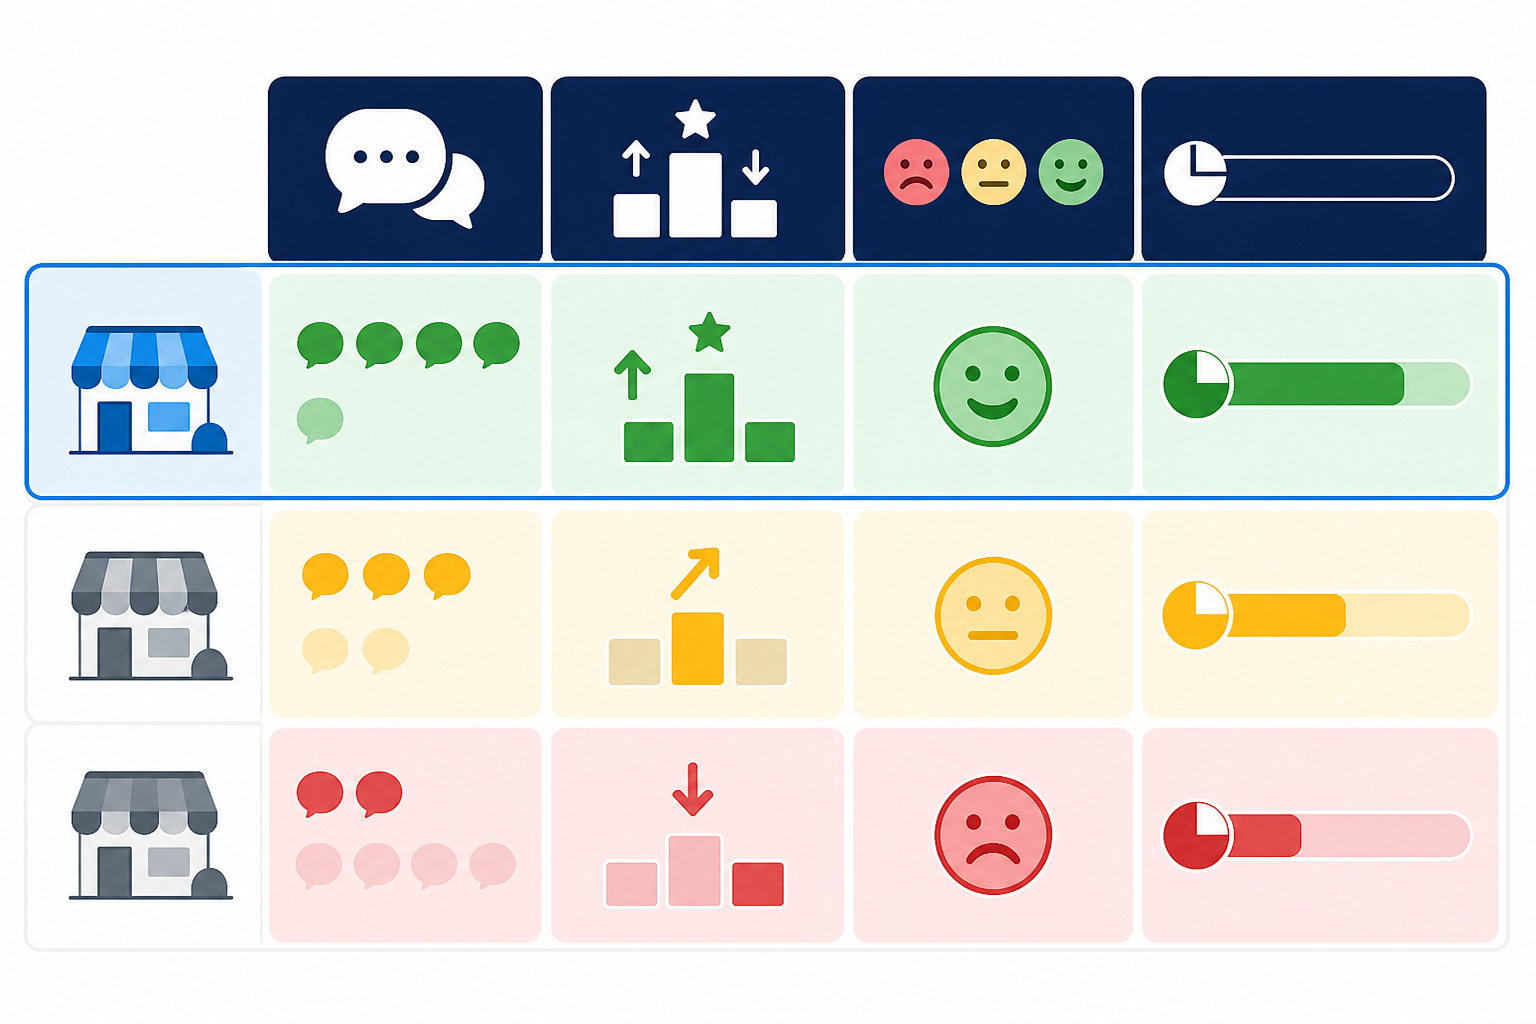
Here is where the honesty matters. The manual approach works, but the arithmetic turns against you quickly. Fifteen queries across five platforms, checked weekly, comes to 75 manual tests per week just to maintain a baseline, before adding a single competitor comparison. At a realistic two to five minutes per test for execution alone, that is roughly two and a half to six hours a week. This is before spending time reading responses, spotting sentiment drift or updating your spreadsheet, which typically takes at least as long again.
That volume would be manageable if AI models were static, but they are not. OpenAI, Google and Anthropic all ship model revisions and retrieval changes on rolling schedules, frequently without a public changelog documenting every change. An answer that favoured you in March can change by June, with little visibility into what caused the shift. I have personally seen sentiment and citation patterns change within the same week for identical queries, with no changes made to the business's website or listings in between.
Human memory and spreadsheets do not scale well when you are trying to catch gradual sentiment drift across dozens of queries over several months. Inconsistent testing conditions — different times of day, slightly different phrasing between sessions, or forgotten location and platform settings — introduce noise that makes genuine trends difficult to distinguish from random variation.
In practical terms, the manual method is likely to be enough if you are testing fewer than 10 queries across two or three platforms, checking monthly rather than weekly, and do not need to report trend data to anyone. Automation becomes worth considering once you cross roughly 15–20 queries, want weekly rather than monthly checks, are tracking more than one location or service line, or are spending more than an hour a week on data collection and review combined. These thresholds are not universal, but they are a reasonable starting point for deciding when a spreadsheet stops being the right tool.
When to Automate AI Share of Voice Tracking
If manual testing has outgrown what you can sustain, use the following checklist when assessing an automated AI visibility tool, regardless of which provider you choose:
- Platform coverage: does it test ChatGPT, Gemini, Perplexity, Claude and Copilot, or only one or two platforms?
- Sampling frequency: do daily runs catch changes faster than weekly ones? This matters if you are trying to correlate visibility shifts with specific website changes.
- Reproducibility: can you see and control location, prompt wording and query history, or is the testing process a black box?
- Citation and soft-mention capture: does it record partial or implied mentions, not just full citations?
- Geographic and service segmentation: can you break results down by town or service line rather than relying on a blended average?
- Exportability: can you access the raw data, or are you locked into a proprietary score with no underlying detail?
- Pricing and data retention: what does it cost at the volume you actually need, and how long is historical data retained?
Example of an Automated AI Share of Voice Tool
In the interest of transparency, MentionOwl is a tool I have worked with directly, so treat the specifics below as one example to evaluate against the checklist above rather than as a neutral market review. It runs daily queries across multiple AI platforms, calculates a 0–100 visibility score built from query coverage, position-weighted citations, share of voice and soft mentions, and includes competitor tracking, website legibility audits and cookieless AI traffic analytics that attempt to show whether improved AI visibility is translating into actual site visits. Trials start at $1 for seven days at the time of writing, although I recommend verifying current pricing directly rather than relying on this figure.
Whatever tool you consider, assess it against the checklist above before committing. Keep exporting enough raw data that you could reconstruct the share-of-voice calculation yourself if necessary.
DIY or Automation: Which AI Share of Voice Method Is Right for You?
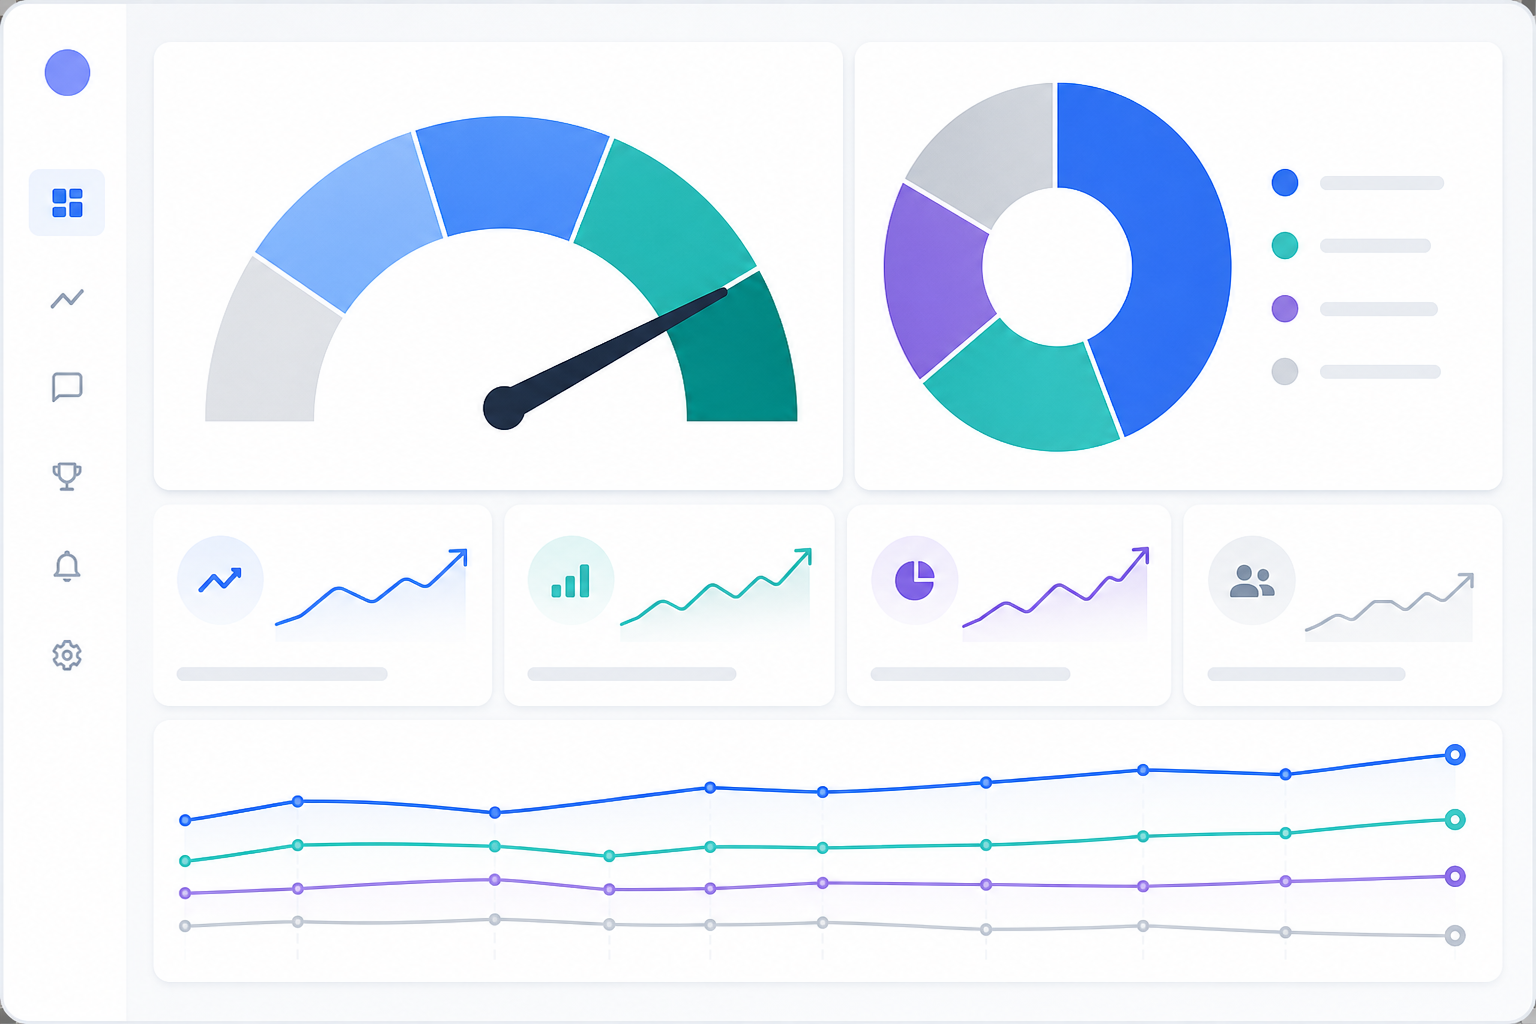
The DIY process is straightforward: build a query list from real customer language across branded, non-branded and competitor prompts; test consistently across platforms with the same location, device and session conditions; log the full response rather than just a yes or no; and calculate share of voice using a fixed formula so the number means the same thing from week to week. That is enough to give you an honest baseline within a few weeks, and it costs nothing but time.
The process breaks down at scale and when consistency becomes difficult. Once you are past roughly 15–20 queries, testing weekly, or tracking more than one location, the hours required to collect and interpret the data reliably can outweigh what a spreadsheet can manage. At that point, automation is not a luxury; it is a more realistic way to keep your data current enough to act on.
Either way, the metric that matters is the same: how often your business is named, in what position, with what tone, and relative to the businesses customers are choosing between.
Frequently Asked Questions About AI Share of Voice
What questions should I be testing in ChatGPT about my business?
Start with the exact phrases a customer would type: “best [your service] in [your town]”, “[service] near me”, and direct comparisons such as “[your business] vs [competitor]”. Split these into branded, non-branded and competitor categories so your results are not skewed towards searches that already include your name. Pull real language from your reviews and sales conversations rather than guessing.
How do I compare myself fairly to a competitor?
Use the same query, platform, location and as close to the same time window as possible. Compare mentions, position, sentiment and share of voice using a fixed formula — your mentions divided by total mentions across you and your competitors, multiplied by 100 — rather than judging your performance from one favourable result.
Is manually checking AI visibility a few times enough?
For an initial snapshot, yes. A handful of manual checks will tell you roughly where you stand today. However, AI models update frequently and answers can vary between identical queries. A one-off check cannot tell you whether you are trending up, trending down or holding steady, which is the information that matters most for business decisions.
How often does AI behaviour change?
More often than many business owners expect. Model providers such as OpenAI, Google and Anthropic push updates on rolling schedules without public changelogs for every adjustment. I have personally seen sentiment and citation patterns shift within the same week for identical queries.
Can I compare AI share of voice across ChatGPT, Gemini and Perplexity directly?
Be cautious. Each platform retrieves information differently and formats answers differently, so a 60% share of voice on one platform is not necessarily equivalent to 60% on another. Track each platform separately and look at trends within a platform before comparing across them. Avoid blending every platform into one number too early.