AI Share of Voice: How to Measure It Against Competitors
Learn how to calculate AI share of voice with a clear share of voice formula, choose competitors, weight mentions by position and set a defensible target.

AI Share of Voice: How to Calculate It, Weight It and Set a Defensible Target
AI share of voice is your brand's share of all tracked-brand mentions across a defined set of AI-generated answers. The core formula is your brand mentions divided by the total mentions of you and your chosen competitors, multiplied by 100. A related but separate measure, answer presence, is the percentage of sampled answers that mention your brand at least once. I treat the first as the headline metric and the second as a companion, and I never mix them. I also refine the headline figure with position weighting and a large, consistent query sample, so that it holds up when a finance director or CEO asks how it was produced. A single percentage with no stated denominator, competitor set or sample size is not a metric. It is an anecdote with a decimal point.
Below is the methodology I use with marketing teams. It covers the unit of measurement, the counting rules that keep the formula honest, how to choose competitors, why position weighting changes the picture, where sampling goes wrong, and how to turn the result into a target you can defend. 📊
Quick glossary: AI share of voice terms
I use these terms the same way throughout.
- Mention: a tracked brand named in an AI answer. Under the counting rule below, each brand counts once per answer.
- Share of voice (share of mentions): your mentions ÷ mentions of all tracked brands × 100.
- Answer presence: answers containing your brand ÷ total answers sampled × 100.
- Weighted share: share of voice after giving earlier or more prominent recommendations more weight.
- Citation: a link to a source in the answer. Its denominator is cited URLs, not brand mentions.
- Soft mention: a brand named in passing, such as in a list of 'other options'.
What AI share of voice means in AI answers
Traditional share of voice describes your slice of a channel: paid media spend relative to the category, social mentions relative to rivals, or organic ranking visibility across a keyword set. AI share of voice borrows that logic but applies it to something different. AI answers are synthesised rather than ranked, they usually name only a handful of brands, and they vary between runs. Ask the same question twice and you may receive a different shortlist. That variability is the main reason the measurement needs more rigour than a screenshot.
The case for taking this to leadership rests on observed behaviour and, more tentatively, on forecasts. Purchase-decision questions, such as 'which accounting software suits a small UK business?', are increasingly put to AI tools rather than typed into a search box. Two sources are worth knowing, and each shows less than it might first appear:
- Observed behaviour: Pew Research Center analysed the browsing activity of 900 US adults in March 2025. It found that 18% of their Google searches produced an AI summary. Users clicked a traditional search result in 8% of visits when a summary appeared, against 15% when it did not. The data is US-based and covers Google only, so it should not be read as a UK or cross-engine figure.
- Forecast, not outcome: Gartner predicted in February 2024 that traditional search engine volume will fall 25% by 2026 as users shift to chatbots and virtual agents. That is a prediction, and you should present it as one.
The cautious reading is that a brand left out of an answer may be absent at the moment of consideration, and the decision may never register in your click data. That is a reasoned inference from the studies above, not a measured result for your category.
The unit of measurement for AI visibility
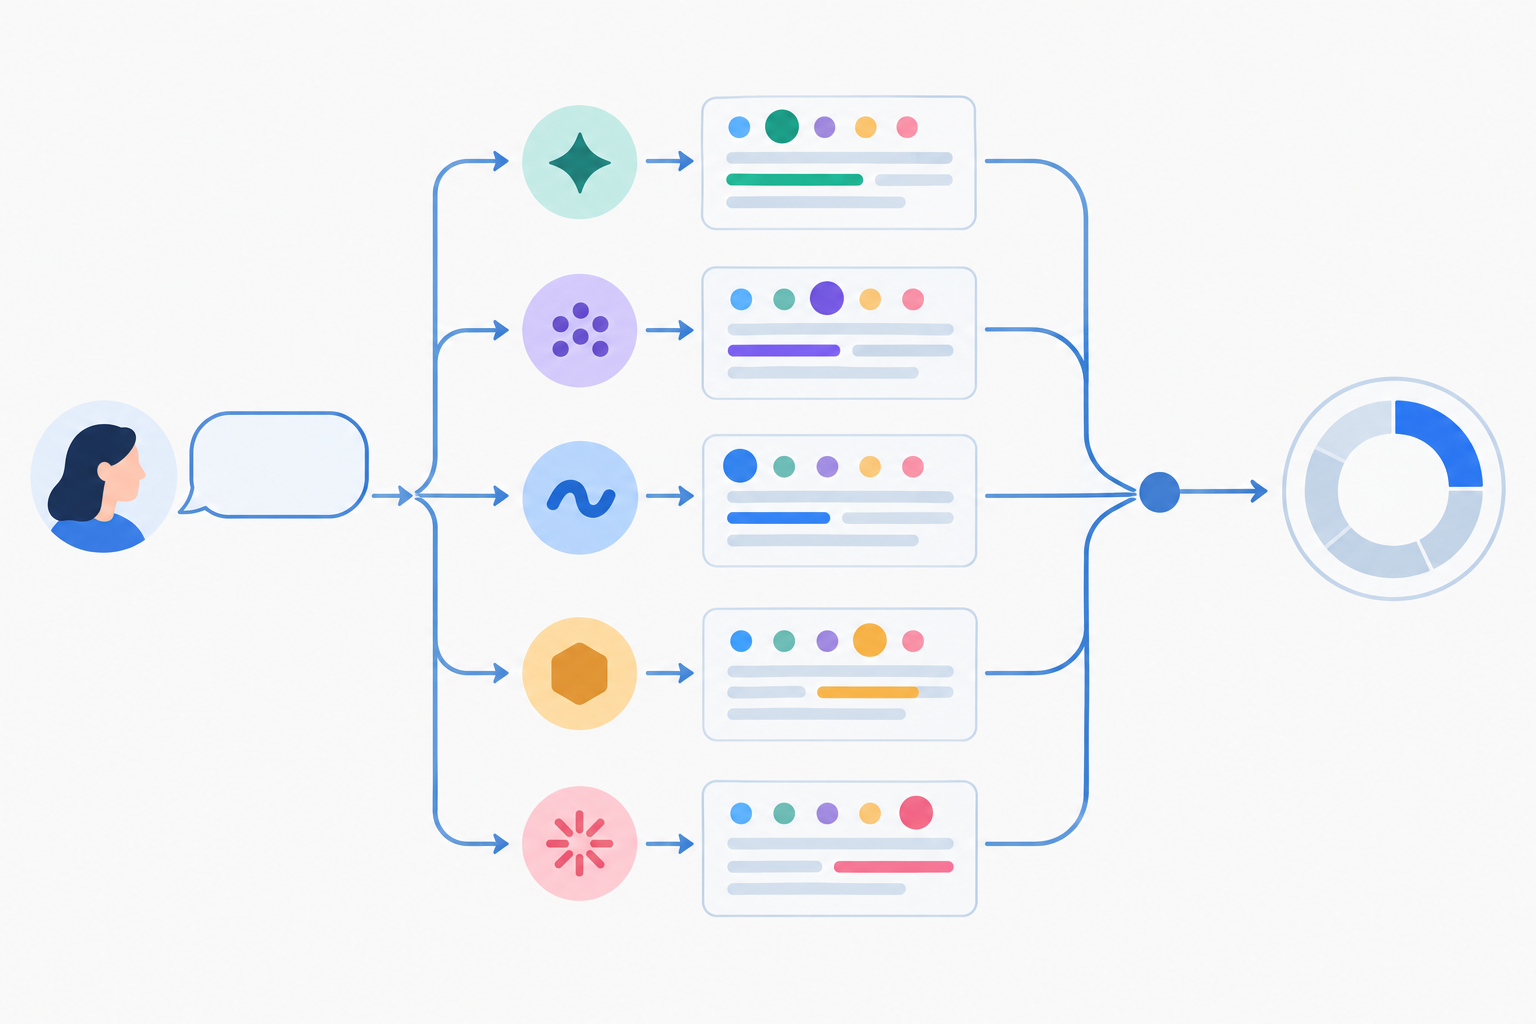
The unit is a mention in an answer to a specific, realistic customer question on a specific engine. That definition matters because it lets you cut the data by engine (ChatGPT, Claude, Gemini, Copilot, Perplexity), by question cluster and by intent. The alternative is one collapsed number that hides where you are strong or weak.
Mentions, citations and soft mentions
Three kinds of visibility are routinely lumped together, and I keep them apart:
- Mentions: the brand is named in the answer text, ideally as a recommendation.
- Citations: the answer links to a source, such as your website or a third-party review that features you. Citation share has a different denominator (cited URLs) from mention share.
- Soft mentions: the brand is named in passing or without a link, for example in a list of 'other options'.
An answer can name you without citing you, or cite your page without making your brand prominent. Combine them and you lose sight of what actually changed. Many tools fold these signals, along with query coverage, into a single composite visibility score. Share of voice is the competitive, relative component of that score, and it is the one a board understands most readily.
The share of voice formula: how to calculate it
There is no standardised industry formula for AI share of voice, which is exactly why you have to define yours and keep it fixed. Write down the counting rules below before running any calculation. Without them, two analysts can produce different percentages from identical answers.
Counting rules to fix before you calculate
- Repeated mentions in one answer count once. If an answer names your brand three times, it contributes one mention, which stops long answers from inflating share. If you prefer to count every occurrence, say so and apply it to every brand.
- Only tracked brands enter the denominator. Brands outside your competitor set are excluded, but log them in a separate 'other' tally so you can spot newcomers worth adding at the next review.
- Ambiguous names are resolved against a written alias list covering product names, common abbreviations and misspellings. If a name could refer to more than one company, exclude it from the count, record it, and report how many were excluded.
- Each run is a separate answer. When a question is run several times, every run counts. For uncertainty estimates, group results by question (see the sampling section).
- Duplicate answers are kept. Identical answers from repeated runs are legitimate observations of how often an engine says the same thing.
- Sentiment is recorded at coding time. Flag negative or cautionary mentions so you can segment or discount them later.
Four steps to calculate AI share of voice
- Build a representative question set. Cover category queries, comparison queries and purchase-decision queries. Whether you write them by hand or generate them from a site crawl, have a human review them to remove oddities and add the questions your sales team hears.
- Run each question across each engine and record every tracked brand named in each answer, applying the counting rules above.
- Count your mentions and the total mentions of all tracked brands.
- Apply the formula: (your mentions ÷ total mentions across all tracked brands) × 100.
AI share of voice formula: a worked example
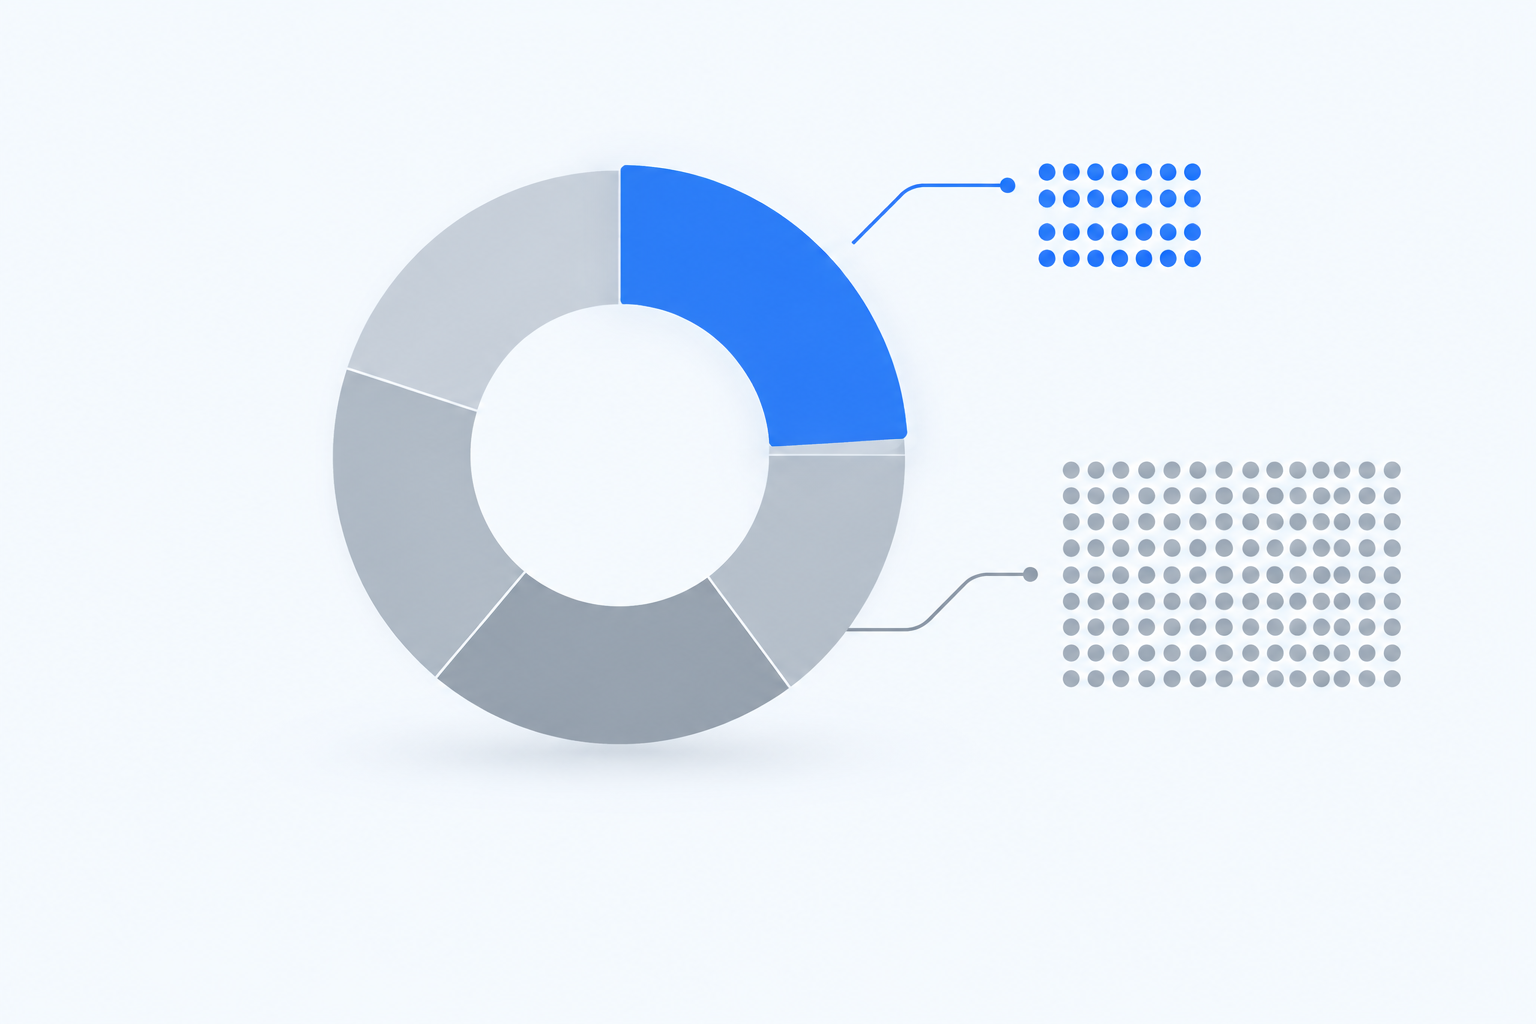
Suppose you run 100 answers (20 per engine) and your brand is named in 40 of them. Across the same 100 answers, the five tracked brands together are named 160 times, an average of 1.6 tracked brands per answer. Your share of voice is 40 ÷ 160 × 100 = 25%. Your answer presence is 40 ÷ 100 × 100 = 40%. Both figures describe the same data, and they answer different questions. This is an illustration, not a benchmark, so please don't compare your own figure with it.
Calculate AI share of voice by engine
The aggregate figure conceals a great deal. Results rarely match between ChatGPT and Perplexity, because the engines draw on different training data, retrieval methods and source preferences. Here is the same illustrative 25%, with 20 answers per engine, broken down:
| Engine | Your mentions | All brand mentions | Share of voice | Answer presence (of 20) |
|---|---|---|---|---|
| ChatGPT | 12 | 36 | 33.3% | 60% |
| Claude | 8 | 30 | 26.7% | 40% |
| Gemini | 8 | 34 | 23.5% | 40% |
| Copilot | 7 | 28 | 25.0% | 35% |
| Perplexity | 5 | 32 | 15.6% | 25% |
| Total | 40 | 160 | 25.0% | 40% |
In this hypothetical the headline is respectable, but Perplexity is a clear weakness at 15.6%. That finding changes where effort goes, and a single blended number would never reveal it.
Share of mentions versus share of answers
These two related measures answer different questions, and I report both:
- Share of mentions divides your mentions by all tracked-brand mentions. It tells you how much of the competitive conversation you occupy.
- Share of answers (answer presence) divides the answers containing your brand by all answers sampled. It tells you how often a customer would see you at all.
The two diverge whenever answers name many brands. A brand present in 40% of answers can hold only 25% share of mentions, as above, because competitors are named alongside it. Keeping both stops breadth of visibility from being mistaken for competitive standing.
Choosing the competitor set for your AI share of voice calculation
Who you include defines the denominator of the formula entirely, so this decision deserves more care than it usually gets.
- Start with the competitors your sales team meets in deals, then add the brands AI engines actually name for your category. In my experience these lists differ, and the gap is informative in itself.
- Use a deliberate mix: two or three direct rivals, one or two aspirational market leaders, and any marketplaces, aggregators or review sites that appear regularly in answers. Label these groups separately so a change is interpretable. A review site is a visibility competitor, not a commercial substitute.
- Remember that set size changes the number. A narrow set inflates your share and a wide one dilutes it, so fix the set and document it before you report a baseline.
- Let the data surface surprises. Review the 'other' tally of untracked brands from recorded answers, because newcomers you had not listed are often the earliest sign of a shifting category.
- Keep a stable core set for trend reporting and a separately labelled discovery set for newly observed brands. That way the denominator doesn't change silently when a new name appears.
- Review quarterly and restate history. When the set changes, recalculate prior periods on the new set so trends remain comparable.
- Mind the UK context. Local competitors, UK-specific retailers and region-specific queries may appear in answers that differ markedly from US-centric results. Use UK-English phrasing and keep the market explicit rather than blending in results from other geographies.
Counting mentions versus weighting position
Raw mention counting treats a brand listed first and a brand listed fifth as equal. That overstates the value of weak placements, and it is the first weakness a sceptical executive will find.
Position weighting gives higher value to earlier or more prominent recommendations. One approach is a descending weight by rank among tracked brands in the answer, ordered by first appearance: 5 points for first, 4 for second, 3 for third, 2 for fourth and 1 for fifth. The weighted share is a brand's sum of weights divided by the sum of weights for all tracked brands, multiplied by 100.
A caution: there is no established standard for position weights in AI answers. Backlinko's 2023 analysis of Google organic results found a 27.6% average click-through rate for the first position. That shows position can matter in search results, but it was measured on a different interface and should not be reused as a weighting curve without validation. Choose your weights, state them openly, and test them against referral behaviour where you can.
Same raw share, different weighted share
The example below is illustrative. Assume 100 mentions across the competitor set and a total weighted pool of 300 points.
| Brand A | Brand B | |
|---|---|---|
| Raw mentions | 10 | 10 |
| Raw share | 10% | 10% |
| Mentions at rank 1 / 2 / 3 / 4 / 5 | 6 / 2 / 2 / 0 / 0 | 1 / 1 / 2 / 3 / 3 |
| Weighted points (5-4-3-2-1) | 44 | 24 |
| Weighted share | 14.7% | 8.0% |
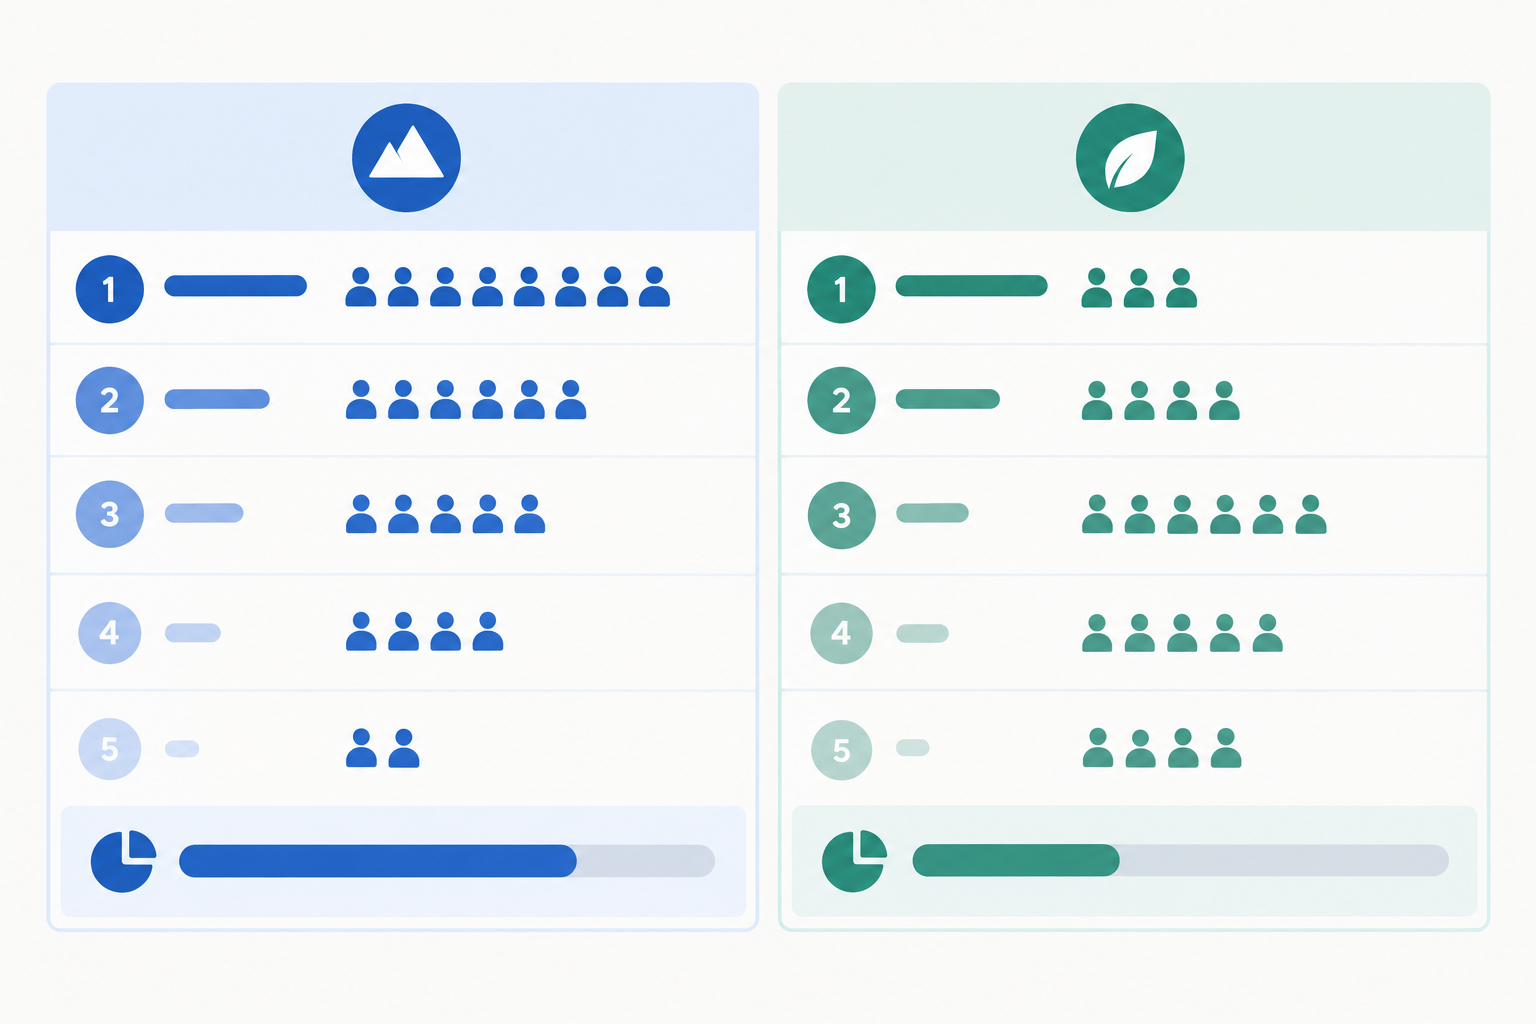
On raw counts the brands are indistinguishable. Once position is applied, Brand A holds almost double Brand B's weighted share. That gap is a useful diagnostic in its own right. A brand whose weighted share trails its raw share is being named but not prioritised, which points towards content and authority work rather than basic discoverability.
Citation position, prominence and sentiment
Two further adjustments alter the commercial meaning of a mention:
- Primary recommendation versus one of many. 'The best option is X' and 'options include X, Y and Z' are not equivalent, and neither is a cited source that features you prominently versus one that lists you at the bottom.
- Sentiment. A cautionary or negative mention should not count the same as a recommendation. Either segment mentions by sentiment or discount the negative ones.
I recommend presenting both raw and weighted share to leadership, with a one-line note explaining the method. The raw figure is easy to verify, and the weighted figure is closer to commercial reality. Showing both also pre-empts the question of whether you picked the flattering one.
AI share of voice sampling and consistency pitfalls
When a share of voice figure collapses under scrutiny, the cause is usually the sample, not the formula. These are the pitfalls I see most often.
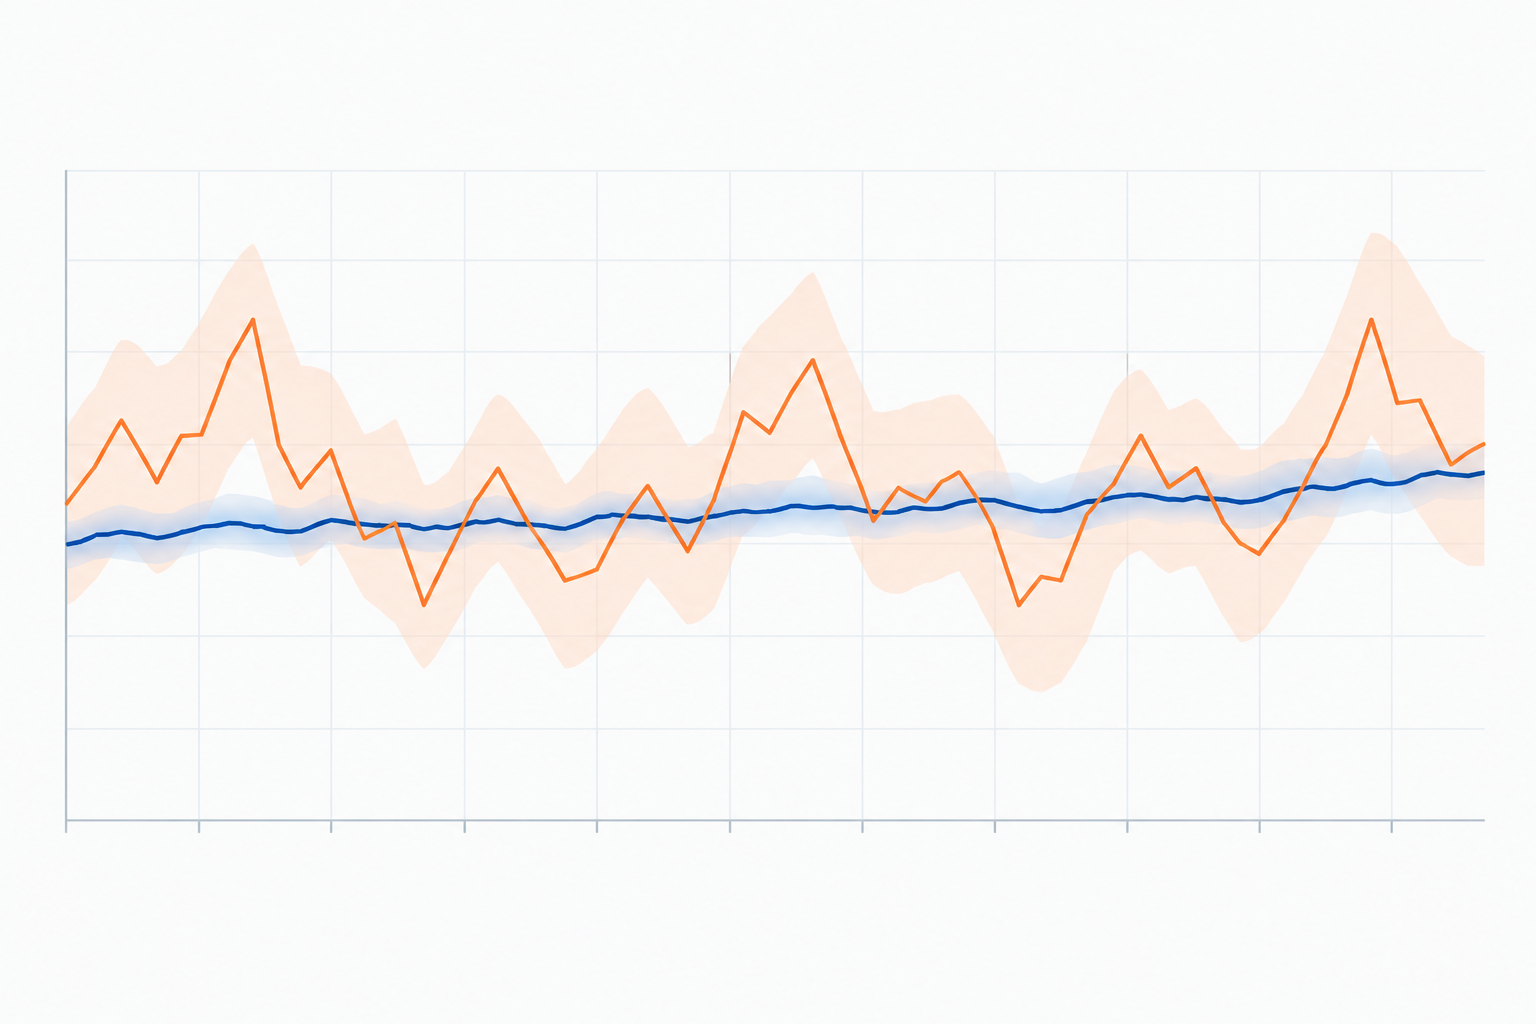
- Small samples. A handful of prompts produces volatile percentages. As a simple approximation, if your true share is 25%, a sample of 100 independent answers gives a 95% margin of error of about ±8.5 percentage points, 400 answers about ±4.2, and 1,600 about ±2.1. These figures assume every answer is independent, and that makes them optimistic. Repeated runs of one question, and the same question asked on several engines, are correlated, so real uncertainty is wider. Treat them as a lower bound.
- Non-determinism. The same question can return different brands on different runs. OpenAI's documentation on reproducible outputs notes that seeded generation makes outputs mostly reproducible but does not guarantee identical outputs. Repeated runs and averaged results are far more reliable than one-off checks.
- Prompt wording bias. Questions that name your brand or use your internal jargon inflate your share, so write questions the way real customers phrase them.
- Engine mix. Weighting all engines equally may not match where your audience searches. Align weights with traffic data where possible.
- Model and feature changes. Updates, browsing modes and personalisation can shift results overnight. Annotate reports with known change dates.
- Mixing branded and unbranded queries. Report them separately, since unbranded queries are the true test of discoverability.
How to report an AI share of voice range you can defend
The independent-sample formula understates uncertainty, so I prefer a simple bootstrap that treats the question as the unit of sampling. You can do it in a spreadsheet or a few lines of code:
- For each unique question, total your mentions and the total tracked-brand mentions across all engines and runs.
- Resample the questions with replacement, drawing as many as you originally had, and recalculate share of voice for that resample.
- Repeat 1,000 times.
- Take the 2.5th and 97.5th percentiles of the results as an approximate 95% range.
Report the range alongside the point estimate, for example '25% (range 20% to 30%)'. If last month's range overlaps this month's, you have not demonstrated a change.
A qualified AI share of voice sampling plan
For a target margin of about ±5 points at a 25% share, the independence-based formula (1.96² × 0.25 × 0.75 ÷ 0.05²) gives roughly 290 answers. If you assume correlation roughly doubles the variance, which is an illustrative assumption rather than a measured one, plan for around 600. One way to get there is 40 unique questions × 5 engines × 3 runs. Unique questions matter more than repeat runs, so I would rather see 100 questions run twice than 20 questions run ten times. Check the result with the bootstrap above and adjust.
Now consider a brand that appears in 18 of 100 answers one month and 24 of 100 the next. Before announcing a six-point gain, check that the prompt set, competitor list, engines, locale, run frequency and counting rules were unchanged. With samples that size, the difference may sit within the margin of error.
AI share of voice consistency checklist
- Fixed question set, with a version number
- Fixed competitor set and alias list, documented
- Fixed engines, with models or interfaces logged where available
- Documented counting rules, position weights and sentiment treatment
- Consistent run frequency and collection window
If any item changes, report the change rather than presenting the result as a like-for-like trend.
Turning AI share of voice into a target
There is no universal benchmark for AI share of voice, and anyone quoting one without a category, competitor set and method deserves some suspicion. A realistic target depends on category concentration, the number of credible competitors and your starting baseline.
As a rough starting comparison, you can calculate an equal-share line: 100 ÷ the number of brands in the set. With five brands that is 20%, and with eight it is 12.5%. I want to be explicit that this is a heuristic, not an expected or inherently fair level of performance. It assumes every brand is equally entitled to an equal slice, which is rarely true. It can mislead when the set mixes a dominant market leader with niche players, or includes aggregators and publishers that engines name often but that you do not compete with commercially. Use it only to see roughly where you stand against an even split, then anchor the real target to your own baseline.
State goals in percentage points against that baseline, with a timeframe and a query segment, for example 'lift weighted share on purchase-intent questions from 20% to 25% within two quarters'. Check that the goal exceeds the bootstrap range of your baseline, otherwise you cannot tell success from noise.
Set targets by query cluster and engine rather than as one global number, so effort goes where the gaps are largest. In the earlier example, a Perplexity target would be more useful than a blended one.
A short scenario: from visibility gap to decision
Imagine a UK accountancy software firm whose illustrative table matches the one above. Its blended share is 25%, but Perplexity sits at 15.6%. The team inspects the Perplexity answers and finds that competitors are repeatedly cited from two third-party comparison sites on which the firm has no presence. They decide to commission data-led comparison content and pursue inclusion on those sites. They set a target of lifting Perplexity share from 16% to 21% over two quarters, and they log the competitor set and question version so the result can be compared like for like. The metric earns its keep through that chain, from finding to action to a measurable follow-up.
Link AI visibility metrics to actions
Share of voice improves through identifiable work, which is what generative engine optimization and AI SEO come down to:
- Content improvements that answer the questions customers actually ask
- Citation-worthy pages, such as original data, clear comparisons and authoritative guides
- Technical legibility. Content that engines cannot crawl or parse is content they cannot cite, so check access, structure and markup
Pair AI visibility with outcomes
Visibility is not traffic, so answer presence and clicks must be measured separately. Pew's March 2025 browsing data (900 US adults, Google) found that users clicked a link inside an AI summary in only 1% of visits where a summary appeared. Separately, Adobe Analytics reported that traffic to US retail sites from generative AI sources rose 1,300% year over year during the 2024 holiday season (1 November to 31 December), according to its January 2025 report. That is a growth measure for US retail, not a share of voice benchmark, and it is illustrative only. It does show why you should track AI referral traffic alongside visibility. Comparing movements in share with movements in AI referrals tells you whether they coincide, without assuming that one caused the other.
AI share of voice reporting cadence and template
- Weekly digests for the team
- Monthly trends for leadership
- Quarterly reviews of the competitor set and targets
A single leadership page needs only the headline share of voice with its range, weighted share, answer presence, change versus the last period, top gaining and losing competitors, and next actions.

Automating AI share of voice measurement with LLM monitoring
Manual spot-checking in ChatGPT does not scale and cannot capture variability, which is the case for systematic LLM monitoring. A person running twenty questions once a week will produce exactly the small, unstable sample described above. Everything in this guide can be done with a spreadsheet and disciplined logging. Automation just makes the large, repeated sample practical.
Example: how one tool automates the method
Full disclosure: MentionOwl is our product, and this is the only section where I describe it. It crawls your website, generates customer questions, and runs them daily across ChatGPT, Claude, Gemini, Copilot and Perplexity, recording answers, citations, sentiment and competitor mentions. Its 0-100 visibility score combines share of voice with query coverage, position-weighted citations and soft mentions. It also runs 16 technical audit checks for AI legibility, and its REST API and MCP server let you pull data into BI dashboards or AI agents. Whichever tool you choose, apply the same tests. Can you see the question set, the counting rules and the competitor list, and can you export the raw answers?
If you want a baseline before committing to a reporting process, MentionOwl offers a $1 seven-day trial. 🦉
Frequently asked questions about AI share of voice
How do I calculate AI share of voice?
Divide the number of times your brand is mentioned in AI answers by the total mentions of all brands in your competitor set, then multiply by 100. Count each brand once per answer, exclude untracked brands from the denominator, and fix these rules in advance. For a more accurate picture, apply position weighting so that being recommended first counts for more than being listed last, and calculate the figure from a large, consistent set of questions.
Which competitors should I include?
Include the direct competitors your sales team encounters, one or two aspirational leaders, and any brands or sites that AI engines repeatedly name for your category. Keep the set fixed for each reporting period and document it, because changing it alters the percentage without any real change in performance.
What is a realistic AI share of voice target?
There is no universal benchmark. Use 100 divided by the number of brands tracked only as a rough equal-share comparison, and remember that it ignores differences in market position and non-commercial entries in the set. Then set targets by query cluster and engine, measured against your own baseline with its range, rather than against a figure from a different category.
How many questions do I need for a reliable result?
Use a decision rule rather than a guess. For a margin of error of about ±5 points at a 25% share, the independence-based formula gives roughly 290 answers, and I would plan for around 600 to allow for correlation between runs and engines. Prioritise unique questions over repeat runs, and verify the resulting range with a bootstrap across questions. Smaller samples are fine for exploration, but report them as such.
Is AI share of voice the same as a visibility score?
No. Share of voice is a relative measure against competitors. A visibility score is a composite that typically combines several factors, such as share of voice, query coverage, position-weighted citations and soft mentions. Definitions vary by tool, so check how any score you are shown is built before relying on it.