How to Report AI Search Performance to Clients: An Agency Playbook
Learn how agencies can report AI search visibility with clear KPIs, client baselines, competitor insights and scalable API-powered monthly reporting.

AI Search Reporting for Agencies: A Client Reporting Playbook
Good AI search reporting for agencies rests on four things: a documented baseline for each client, a small set of KPIs clients can understand, a monthly narrative that links changes to specific actions, and automated data pulls so agency AI visibility reporting can scale across your roster. The core KPIs are visibility, share of voice, citation measures and sentiment. Query coverage and AI referral traffic support them. Because AI answers vary from run to run, report trends over time rather than single snapshots, and always show competitor context.
That is the short version. The rest of this playbook covers how to build client reporting for AI SEO, how to set expectations before the first report goes out, and how to scale the process without drowning analysts in screenshots. 📊
Why AI search reporting differs from traditional SEO reporting
AI answers have no fixed rankings. A response varies between runs, platforms and question phrasings, so one screenshot of an assistant recommending your client proves very little. Traditional reporting centres on clicks, impressions and average position. AI search reporting asks whether a brand is mentioned, cited, recommended and described accurately. A page can be cited without generating a visit, which is why click-based reporting alone understates AI exposure.
The research points to a measurement problem, though every source has limits:
- Pew Research Center analysed 68,879 Google searches by 900 U.S. adults (March 2025). Users clicked a traditional result in 8% of visits when an AI summary appeared, versus 15% when none did, and only about 1% clicked a link inside the summary. The sample is U.S.-only, so UK behaviour may differ.
- Ahrefs reported a 34.5% lower click-through rate for the top-ranking page when an AI Overview appeared, across roughly 300,000 keywords. The finding is observational, so it is not a guaranteed effect for any one site.
- Gartner forecast in 2024 that traditional search engine volume would fall 25% by 2026. It is a forecast. Use it as market context and never as a client traffic projection.
There is also a data-availability problem. Google states that AI Overviews and AI Mode traffic is included in the overall Web performance report in Search Console, so you cannot isolate it cleanly. Bing Webmaster Tools' AI Performance public preview reports Copilot citations and grounding queries, but that covers one platform. Nothing first-party covers ChatGPT, Claude, Gemini or Perplexity comprehensively, so most agencies need prompt-based sampling alongside first-party data.
Keep measuring organic clicks, sessions, leads and revenue, and label every AI metric by source and method. One caution on sampling: repeated runs reduce noise only when conditions are held constant, the runs are reasonably independent (repeats within one cached session are not), and volumes are adequate. Section three explains how to check this.
Setting client expectations for AI search reporting
Most reporting disputes are expectation disputes that began at kickoff. Settle these points before you send a chart:
- Outcomes are probabilistic. You can improve the likelihood of being cited and recommended, but you cannot guarantee a specific mention, so price and promise against defined work rather than a number of mentions.
- Agree the scope. Confirm the platforms and the customer questions that matter commercially. A question set built from real purchase decisions beats a long list of vanity prompts.
- Define success in stages. In the first 90 days, success is usually coverage. Over 12 months the focus shifts to citation quality, sentiment and the accuracy of what engines say.
- Put it in the statement of work. Cadence, KPI definitions, question set, competitor list and data caveats belong in writing, along with a note that scope changes (new prompts, new markets) reset comparisons.
- Explain volatility once, properly. Small swings are normal. Any numeric alert threshold is a monitoring rule calibrated from your own baseline variation, not proof of change. Movements well outside the baseline range that persist over several days are worth investigating.
A kickoff script agency leads can adapt:
'AI assistants give probabilistic answers, so the same question can produce different responses. We run your tracked questions repeatedly and report trends, not single snapshots. In the first 90 days we establish a baseline and aim to improve how often you appear. Citation quality and sentiment are longer-term goals. We will flag sustained movement against your baseline and named competitors, not week-to-week wobble.'
How to build AI search baselines and benchmarks
Your first deliverable should be a baseline, not a performance review. Without one, every later number floats free of context. Treat the following as a starting protocol and adapt it to your volumes:
- Build the question set from the client's site and sales conversations, review it with the client, and version it.
- Fix and record test conditions: market, language, logged-out or account state, interface or API source, and date. For UK clients, set the country to the United Kingdom and use British English and UK phrasing ('solicitor', 'VAT'). Keep a separate question set and baseline for each market or language, such as Welsh-language content or UK and Irish markets, and never blend them.
- Run every question on every in-scope platform repeatedly, typically for one to two weeks, and record runs per question and platform. Keep results segmented by platform and question, and do not pool across platforms.
- Check that volume is adequate. For a coverage rate p from n valid runs, a rough 95% interval is p ± 1.96 × √(p(1−p)/n). A 40% coverage rate from 100 runs gives roughly ±10 points. Repeats of one prompt are correlated, so treat that as a lower bound on uncertainty. If the intervals are too wide to be useful, or results are still unstable, extend the baseline rather than reporting it.
- Record starting values and their components, and capture sentiment and inaccuracies. Outdated or unflattering claims often turn out to be the most persuasive early findings.
- Run a technical legibility audit for site-level issues that may limit how readily AI engines read and cite the content. Then benchmark against three to five named competitors, because relative position is what a board cares about.
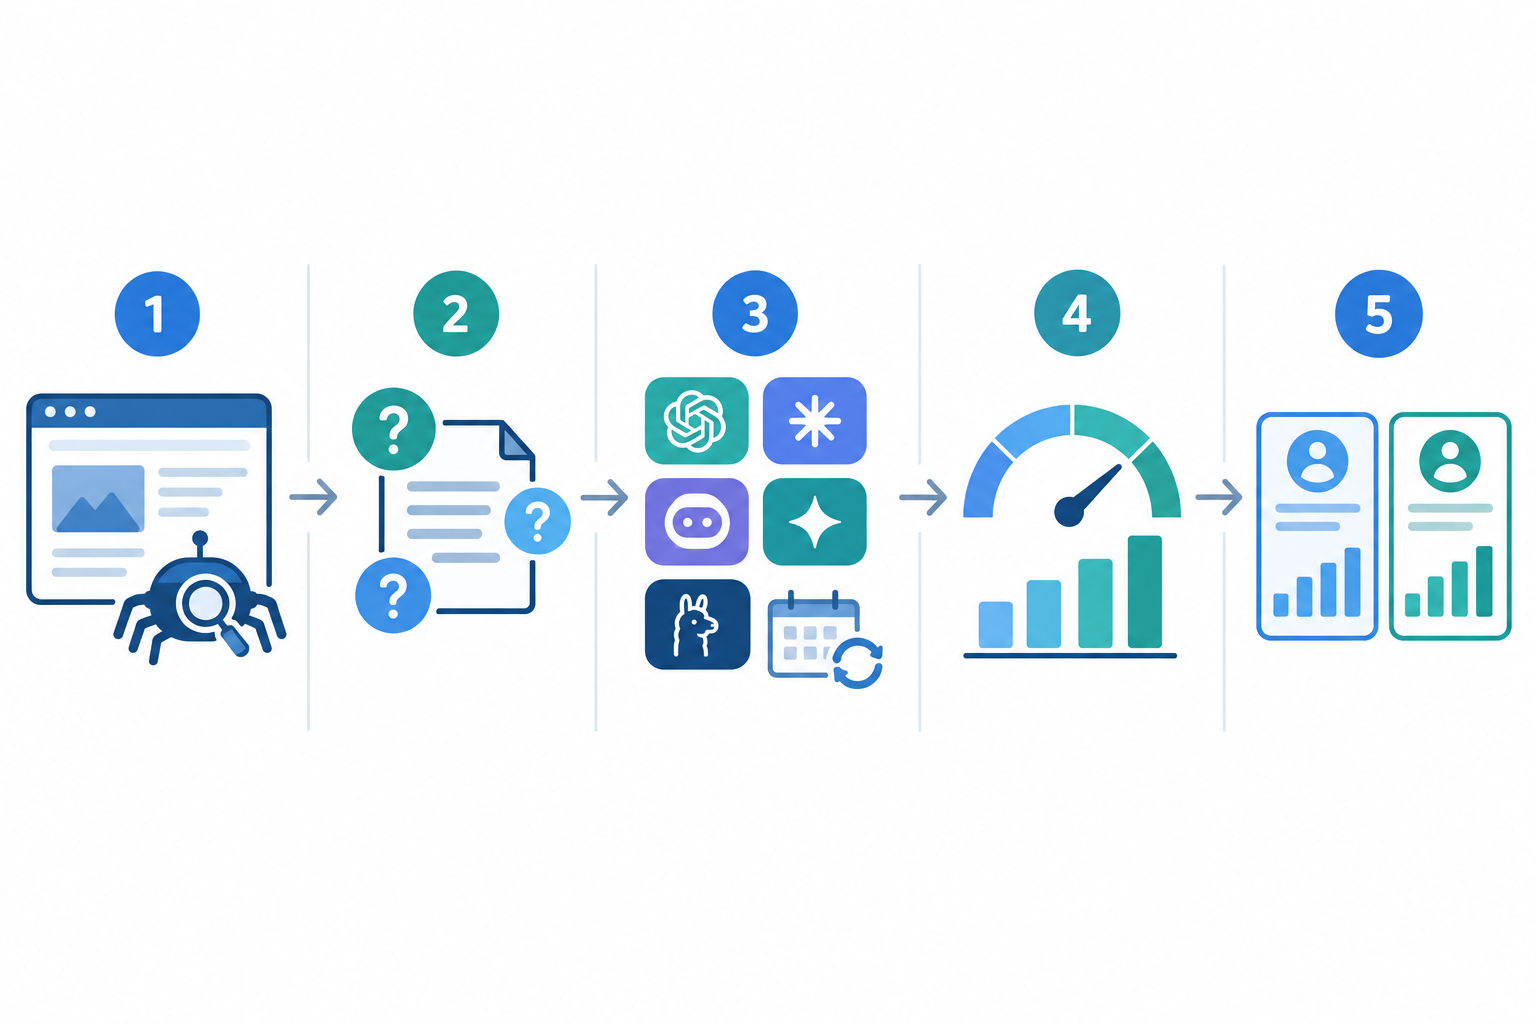
Document the methodology so the baseline is still defensible six months later. That means platforms, exact question list and version, geography, language, date range, run counts, competitor set and scoring definitions. Log any change to prompts or competitors so a methodology change is never mistaken for a performance change, and label platform-reported data (such as Bing's) separately from prompt-sampled data.
Which AI search KPIs do clients understand?
Clients do not need forty metrics. They need a handful they can repeat in a board meeting. I recommend four core indicators and two supporting measures. Definitions matter as much as names, because two teams using different denominators will produce numbers that cannot be compared.
| KPI | Tier | Operational definition | Why it matters to the client | Caveat |
|---|---|---|---|---|
| Visibility score (0-100) | Core | A composite of coverage, citation and mention measures (illustrative formula below) | One trend line the board can follow | Method-dependent; compare only within one methodology |
| Share of voice (mention share) | Core | Client mentions ÷ all mentions of tracked brands, same questions and period | Shows whether the client is winning or losing ground against rivals | Depends on the competitor set; sums to 100% across brands |
| Citations and citation position | Core | Share of answers citing at least one client URL; rank of the first client URL among sources | Shows which pages engines trust, and where to invest in content | Platforms order sources differently; report per platform |
| Sentiment | Core | Each mention coded positive, neutral or negative against a written rubric | Reveals how the brand is described, not only whether it appears | Automated coding needs a human review sample |
| Query coverage | Supporting | Valid runs in which the brand appears ÷ total valid runs, with run counts | Shows how many buying questions the brand is present for | Reflects the chosen question set |
| AI referral traffic | Supporting | Visits from identified AI platforms | Connects AI exposure to site behaviour | Attribution is incomplete; many visits appear as direct |
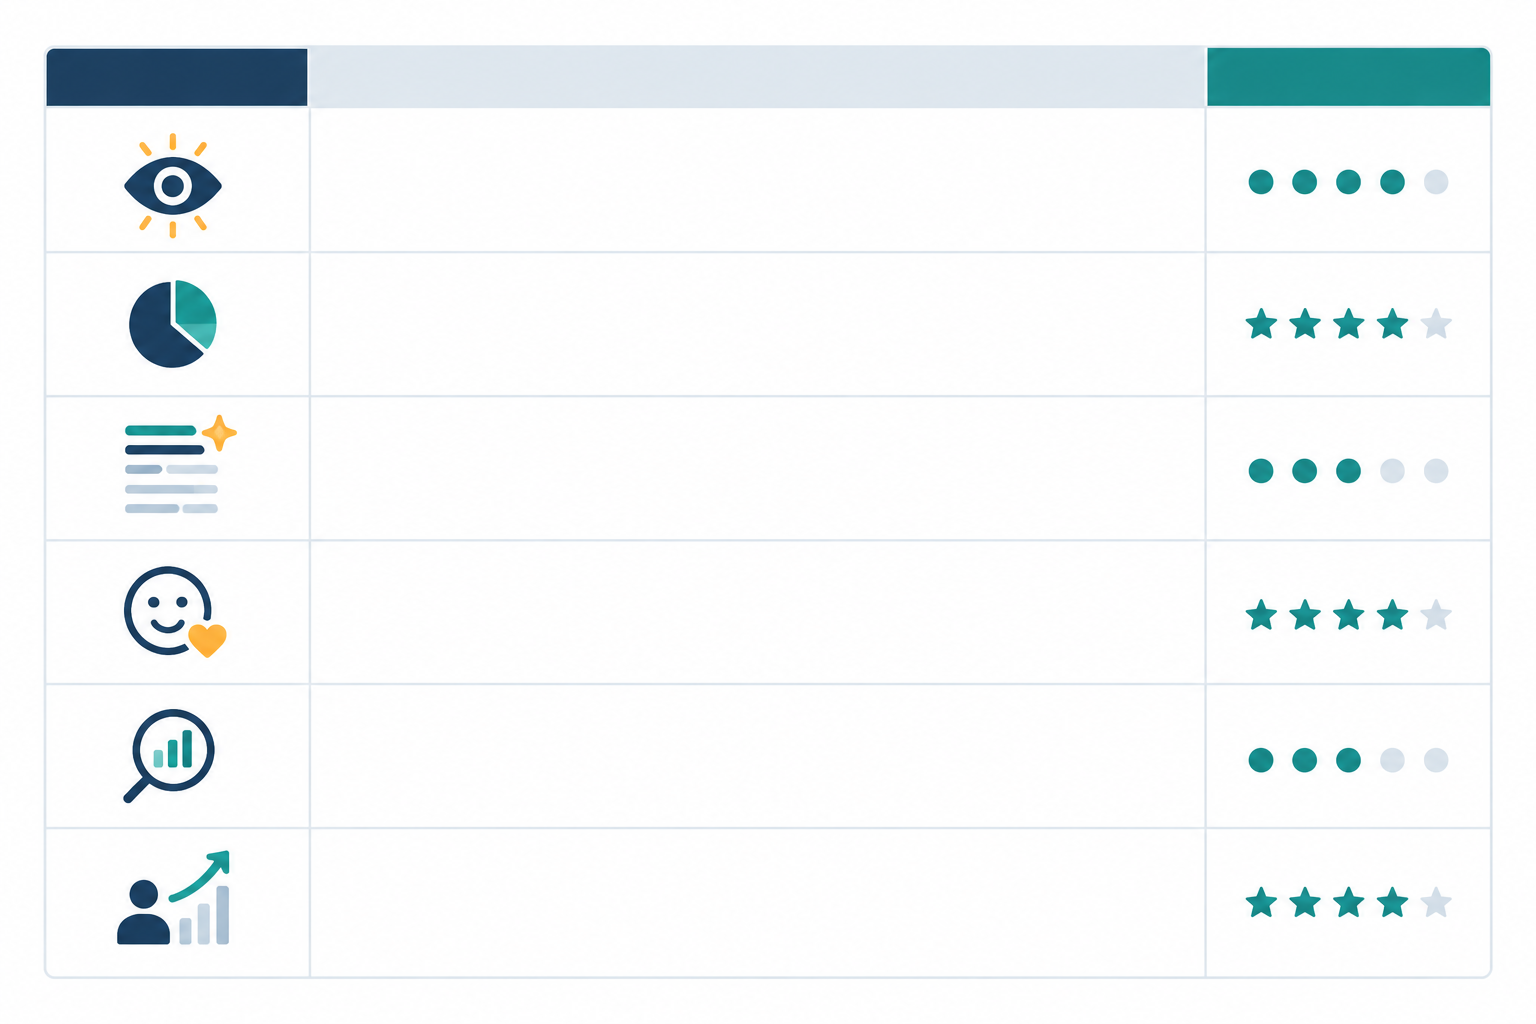
The graphic above is the client-facing version of the table. It uses plain-English wording and a client-friendliness rating, while the counting rules stay in the table for your analysts.
Take share of voice first, with a worked denominator. Suppose you have 10 valid answers to one question set. The client is mentioned in 6, Competitor A in 5 and Competitor B in 3, which gives 14 brand mentions in total. Share of voice is 6 ÷ 14 = 43% for the client, 36% for A and 21% for B, and those sum to 100%. Answers naming no tracked brand sit outside the denominator, so report them as a separate 'no tracked brand' rate. Query coverage is a different number. Here it would be 6 ÷ 10 = 60%, and it does not sum to 100% across brands. Always state which one you are reporting.
Now the visibility score, with an illustrative formula. Proprietary scores vary by tool, so I treat them as tool-specific rather than a universal agency KPI. As an example only (not an industry standard): score = 100 × (0.5 × coverage rate + 0.3 × citation rate + 0.2 × first-mention rate). With 60% coverage, 30% citation and 20% first-mention rates, that gives 100 × (0.30 + 0.09 + 0.04) = 43. If your tool's formula is not disclosed, show coverage, citation and mention rates separately on page one.
Two rules keep numbers reproducible. First, state how runs are aggregated. I recommend pooling valid runs over the period, discarding errors and noting how many were excluded. Second, do not compare scores across platforms unless your methodology supports it, since a Perplexity mention with prominent sources is not equivalent to a conversational answer with none. Citation presence, referral traffic and conversions are three distinct measures, so keep them apart.
What goes on page one? Visibility (or its components), share of voice and sentiment. Citation detail, query coverage, referral traffic and audit findings belong in the appendix.
What to include in a monthly AI SEO client report
Consistent structure matters more than clever design. This is the seven-part format I recommend:
- Executive summary. Three sentences: what changed, why, and what happens next.
- Headline metrics, with month-on-month and since-baseline deltas, plus run counts.
- Platform breakdown. A blended number can hide a serious gap.
- Competitor context: who gained or lost ground, and who is cited in the client's place.
- Query-level wins and losses.
- Actions taken and hypothesised effect, linking content updates, schema changes, digital PR or technical fixes to movements.
- Next-month priorities, with owners and timelines.
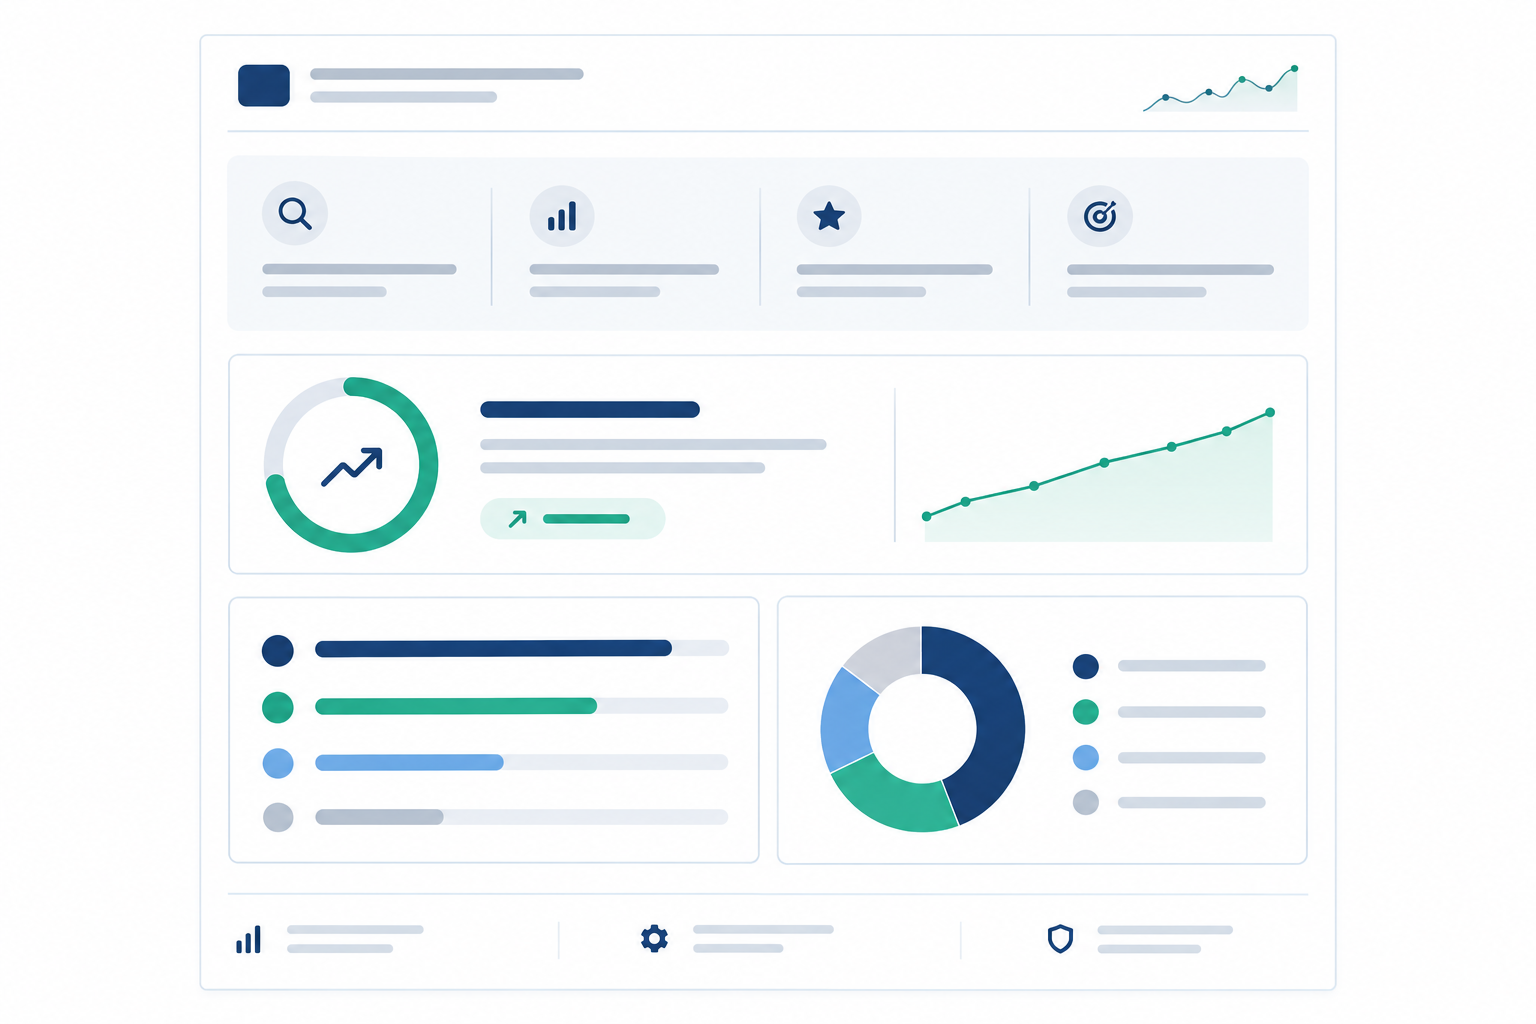
Here is a worked example (hypothetical). A UK accounting-software client's share of voice in Gemini and Copilot falls from 31% to 24% over three weeks, while ChatGPT holds steady. The query-level view shows the drop is concentrated in 'best software for sole traders' questions, where a competitor's new comparison page is now cited. That is a correlation, not a verified cause. The agency's narrative reads: 'Share of voice fell seven points on two platforms. A rival comparison page appears alongside the drop. We have published our own comparison page and refreshed pricing, and we hypothesise this will recover coverage; we will check over four weeks.' Three things would strengthen the hypothesis: the rival URL appearing in the cited sources of the affected answers, the decline staying confined to those questions, and no concurrent change in our question set or run conditions. Never claim AI visibility alone caused revenue changes. Google's own guidance says foundational SEO practices apply to its AI features, so overlapping causes are likely.
Different readers need different formats. Give senior stakeholders a one-page version (summary, three headline metrics, competitor chart, priorities) and give marketing teams a longer appendix.
How to explain negative AI search reporting results
Every agency will eventually report a decline. Diagnose first, because the three usual suspects need different responses. A model update shows up as a simultaneous shift across many clients and unrelated questions. Competitor activity shows up as a rival newly cited for the same questions. A genuine content problem means outdated pages, thin answers or technical barriers.
Compare the movement with the baseline variation and uncertainty ranges described above. A two-day dip that recovers is likely variance, whereas a three-week decline across several platforms looks like a real shift. Those durations are illustrations, and your own thresholds should come from your data.
Frame negative sentiment as a remediation plan. If engines repeat an outdated pricing claim, update the source pages, strengthen corroborating third-party coverage and monitor whether the answer changes. Communicate bad news early, ahead of the monthly report. A short note with a diagnosis and a plan builds more trust than a surprise on page three.
How to scale agency AI visibility reporting across clients
Depth does not scale on its own. These practices keep quality high as the roster grows:
- Standardise templates and KPI definitions, and keep client-specific brands, categories and locations in separate configuration.
- Tier your reporting: weekly digests for awareness, monthly narratives for stakeholders, quarterly strategy reviews.
- Use naming and tagging conventions for clients, competitors and question sets so data joins without manual clean-up.
- Run a QA checklist before sending. Did the question set change? Did a platform return errors? Is a drop a spike or a trend?
- Keep observed and estimated data apart, preserving source, date, market and metric definitions.
- Decide on white-label or co-branded delivery. Clients generally expect your branding, plain-English definitions and a methodology note, not raw tool screenshots.
Illustrative planning assumption, not a benchmark: a manually compiled report might consume six to eight analyst hours per client per month, and an automated workflow one or two. Time a pilot client before and after, and use your own figures in the business case.
How to automate AI visibility reporting with an API
If your monitoring tool offers an API, you can pull results into your own dashboards. Before committing, check that the vendor provides:
- Current documentation, authentication and quotas, including per-client keys, rate limits and pagination.
- Raw answers rather than only aggregated scores, so you can recompute metrics under your own definitions.
- Versioning, with the API version recorded alongside each extract.
On your side, schedule pulls with backoff retries, alert on missing days rather than reporting gaps as zeros, and store timestamped raw extracts in BigQuery or Google Sheets. Then connect Looker Studio, Power BI or Tableau alongside first-party sources. Search Console's API (up to 25,000 rows per request) and the GA4 Data API supply organic and engagement data, but keep those sources distinct because they measure different user actions. Add alerts for sustained score drops or new negative mentions so your team hears before the client does. If your vendor offers an MCP server, internal AI agents can draft first-pass commentary, but keep human review in place before anything reaches a client.
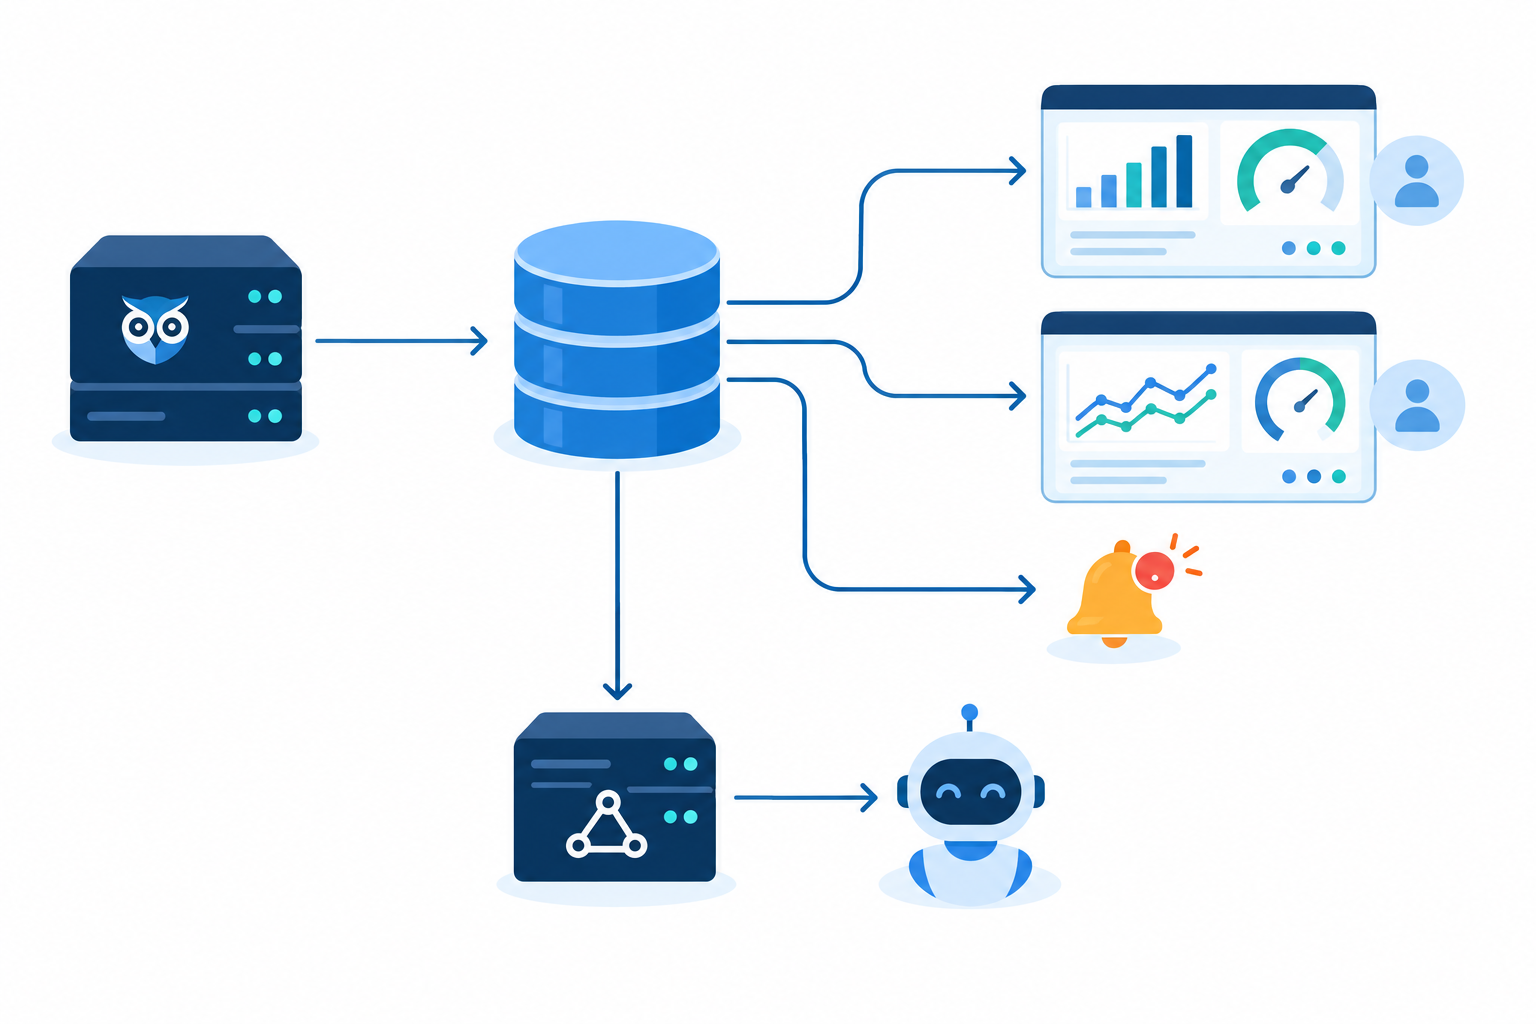
Governance deserves a moment too. Your warehouse will probably sit beside client analytics that may include personal data. Under UK GDPR and the Data Protection Act 2018, put data processing agreements in place, restrict access by client, limit retention and check provider terms before sending client data into AI tools.
How to price AI visibility services
I will not invent market rates, because no established ones exist. Price against a defined scope, and check your figures against your own cost base and competitors' published rate cards.
| Model | How it works | Best for | Watch out for |
|---|---|---|---|
| Fixed monthly retainer | Flat fee for monitoring, reporting and strategy | Clients wanting predictability | Scope creep |
| Tiered packages | Tiers by questions, platforms and competitors | Varied client sizes | Tiers must reflect workload |
| Add-on to SEO retainer | AI visibility layered onto existing work | Existing clients; easiest sale | Undercharging for analyst time |
| Audit plus implementation | One-off baseline and fixes | Low-risk entry | No recurring revenue unless converted |
Cost drivers include the number of competitors tracked, platforms, markets and languages (Google has said AI Overviews reach over 200 countries and territories and more than 40 languages), plus content production and consulting time. Here is a margin framework in pounds sterling: monthly margin = fee − (tooling cost + analyst hours × loaded hourly cost + strategy hours × loaded hourly cost + content production cost). Check that it holds at your target client count.
A 30-60-90 day AI search reporting rollout
- Days 1-30, pilot. Choose one or two clients, build baselines, run legibility audits and draft the report template.
- Days 31-60, refine. Tighten KPI definitions, deliver the first monthly narrative and find out what clients actually read.
- Days 61-90, scale. Connect the API, roll out to the wider roster and set pricing.
Copy this checklist into your project management tool:
- Statement of work covers cadence, definitions and caveats
- Question sets versioned, set to the correct UK market and language
- Baseline complete, with run counts and uncertainty ranges recorded
- Three to five competitors agreed
- Report template and QA checklist finalised
- API pulls scheduled and failure alerts tested
- UK GDPR review completed
- Pricing model and entry offer documented
Frequently asked questions about AI search reporting for agencies
How often should agencies report on AI search performance?
Monitor daily, send a short weekly digest and deliver a full narrative monthly. Monthly and quarterly trends are more reliable than weekly changes.
What KPIs do clients understand best?
Visibility (or its components), share of voice and sentiment. Keep citation detail and audit findings in an appendix.
Can I pull AI visibility data into my own dashboards?
Yes, if your tool provides an API. Confirm it exposes raw answers, check quotas and versioning, and store timestamped extracts.
How do I explain fluctuating AI results to a client?
Explain that generative engines give probabilistic answers, show trend lines with run counts, and focus on sustained movement against the baseline.
Should I include competitors in client reports?
Always. Share of voice against named competitors shows whether the client is gaining or losing ground.
How do I compare results after changing a prompt set?
Do not splice the series together. Run old and new sets in parallel for a few weeks, report overlapping questions as a like-for-like trend, and start a marked new baseline for added questions.
Disclosure
I work on the team behind MentionOwl, an AI visibility monitoring platform with a REST API and MCP server. Its visibility score is a proprietary composite and its features are vendor claims, so check current product documentation and trial terms before relying on them. The methods in this playbook apply equally to other tools or a carefully managed manual process.