How Brands Quietly Lose Share of Voice in AI Answers: A Guide for Agencies
Learn how to track share of voice in AI answers, spot competitors overtaking your brand, and use AI visibility monitoring to catch declines before traffic falls.

Share of Voice in AI Answers: How a Brand Slips from First to Absent While Traffic Looks Stable
For this guide, “share of voice AI answers” is shorthand for how often a brand appears in relevant AI responses compared with competitors. Brands rarely lose share of voice in AI answers in one dramatic event. The loss is gradual: a competitor gets cited a little more often, the sources a model draws on shift, or a platform update changes which brands it names. None of this shows up clearly in traditional analytics. The most reliable way to catch it is AI visibility monitoring at question level. You run the same prompts repeatedly and track position, citations, sentiment and competitor mentions, instead of relying on the occasional manual spot check. 🦉
This guide is for UK agencies managing several clients across ChatGPT, Claude, Gemini, Copilot and Perplexity. I cover how a decline in AI visibility happens, why dashboards miss it, how to measure share of voice in AI answers without overstating what the numbers show, and what a workable detection and response routine looks like.
A note on method that applies throughout: the Northbeam scenario is hypothetical, and none of its figures are real data. Every signal I describe is evidence to investigate, not proof of cause. Platforms differ and change often, so treat the thresholds here as starting points and calibrate them on your own data. Sources are linked inline and listed at the end.
The scenario: from first recommendation to absent in ten weeks (an illustrative example)
Imagine a UK mid-market project management software brand, which I will call 'Northbeam'. Your agency manages its search and reputation work. When a prospective customer asks an AI assistant, 'What is the best project management tool for small UK teams?', Northbeam is the first recommendation. The next ten weeks unfold like this:
- Week 1: Northbeam is named first, with a linked citation to its own comparison page.
- Week 4: It is second, behind a competitor that has begun appearing in the same answers.
- Week 7: It is reduced to a soft mention, named in a list without a link or a reason to choose it.
- Week 10: It is absent from most answers to the question.
Meanwhile, organic sessions and branded search stay inside their normal range. The monthly report reads 'stable', the client is content, and nobody has a reason to look closer.
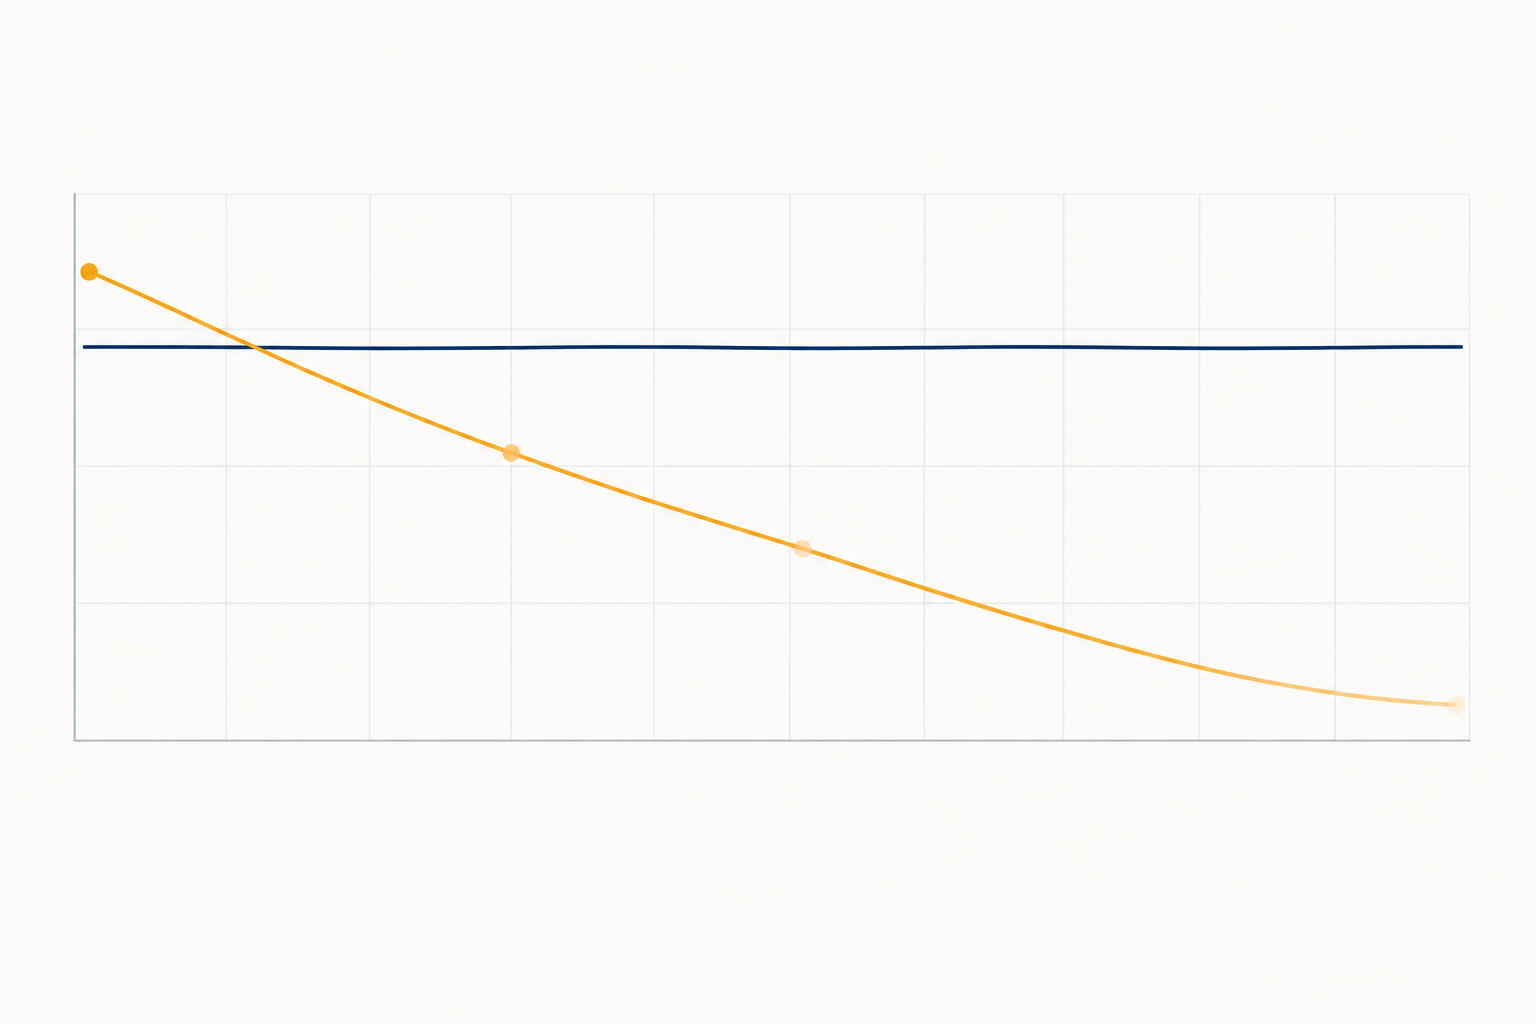
The two lenses tell different stories. Through the analytics lens, sessions are flat, branded search is flat and no alerts fire, so the verdict is 'fine'. Through the AI answer tracking lens, position, citations and share of voice fall steadily on a high-intent question, and the verdict is a serious problem that may still be recoverable. A decline in AI answers can be real and measurable while staying invisible to the dashboards most agencies report from. That gap is the whole point of this article.
Why AI visibility loss is invisible in analytics
Traffic reporting cannot reliably detect a decline in AI visibility or share of voice in AI answers, and there are several structural reasons for that.
- Answers often resolve the question without a click. A brand can be named in an AI answer without the user visiting its site, so a lost recommendation does not necessarily appear as a lost session. Pew Research Center's analysis of a panel of US adults' browsing in March 2025, published in July 2025, found that users clicked a traditional result in 8% of visits when a Google AI summary appeared, against 15% when there was none, and clicked a link inside the summary in about 1% of visits. Separately, SparkToro and Datos estimated in 2024 that 58.5% of US Google searches and 59.7% of EU searches ended without a click to the open web. Both sources measure click behaviour, not any brand's exposure in answers, and the second covers search generally, not AI answers. Neither is a UK measurement, and I have not found UK evidence of comparable quality. Read them as an illustration of why clicks understate exposure, not as a UK traffic-loss estimate.
- AI referrals are only partly attributable. OpenAI states that ChatGPT search links include the parameter utm_source=chatgpt.com, so some clicks can be identified. That captures clicks, not appearances, and visits from other platforms may arrive without clear referrer data. Referral tracking cannot reveal an unclicked mention.
- Search Console has no separate view of AI answers. At the time of writing, Google's documentation on AI features says traffic from AI Overviews and AI Mode is counted in the overall Web search performance data, with no dedicated filter. Google's reporting changes quickly, so check the current page. The documentation also says nothing about other platforms, and rank trackers measure the classic results page, not the generated answer.
- Lagging indicators arrive late. Branded search and pipeline tend to move after visibility changes, so by the time they react a competitor may be well established.
- Averages hide the queries that matter. A flat overall line can mask erosion on a handful of high-intent, purchase-decision questions, and those are the ones closest to revenue.
Traffic is a lagging indicator and answer-level monitoring is the leading one. An agency reporting from traffic alone is reporting on the consequences of earlier visibility.
Measuring share of voice AI answers: a practical framework
Share of voice in AI answers is the proportion of relevant answers, across a defined question set, in which your brand appears compared with competitors. The definition is simple, but the number is only as good as the consistency behind it. I would fix these definitions before collecting any data:
- Appearance rate (coverage): the share of runs, for a given prompt set and platform, in which the brand is named at all.
- Share of voice: the brand's mentions divided by all mentions of tracked brands (yours plus named competitors) across the same runs.
- Position: the order in which the brand is first named, where 1 is first. Average it only across runs where the brand appears, and report it beside appearance rate so that dropping out is not hidden by a good average.
- Hard citation, third-party citation and soft mention: a hard citation links to the brand's own domain, a third-party citation links to another site discussing the brand, and a soft mention names the brand with no link. A displayed citation shows which source the platform surfaced, not why the brand was chosen, so treat it as evidence of association.
- Sentiment: coded against a fixed rubric (recommended, neutral, qualified, negative), with a human reviewing a sample.
Weighting by position is a reasonable reporting choice. But I am not aware of robust public evidence quantifying how much more users act on the first-named brand in AI answers, so any weights are a convention and you should state them openly.
A worked example of AI visibility monitoring (hypothetical)
Suppose an agency tracks 20 customer questions for Northbeam on one platform, running every prompt once on each weekday. That gives 100 observations per platform per week. Over a four-week baseline (400 runs), Northbeam appears in 62% of runs with an average position of 1.6 when present. In the latest week it appears in 48 of 100 runs (48%), with an average position of 2.4, and soft mentions have risen from 15% to 35% of its appearances.
The 14-point fall is a clear signal, but it is not a statistically established decline. Even if every run were independent, the rough 95% interval on the difference between a 400-run baseline and a 100-run week is about plus or minus 11 points, so the drop barely clears it. The runs are not independent, though. They are clustered within 20 prompts, and repeating the same prompt does not add 100 independent questions. The effective sample is closer to the prompt count than the run count, so the true uncertainty is wider. The honest reading is that this is a reason to investigate and keep collecting. A prompt-level view helps here: in how many of the 20 prompts did appearance rate fall, and by how much? A broad fall across many prompts and platforms is more convincing than a large fall on two. Report the observation and prompt counts with every figure.
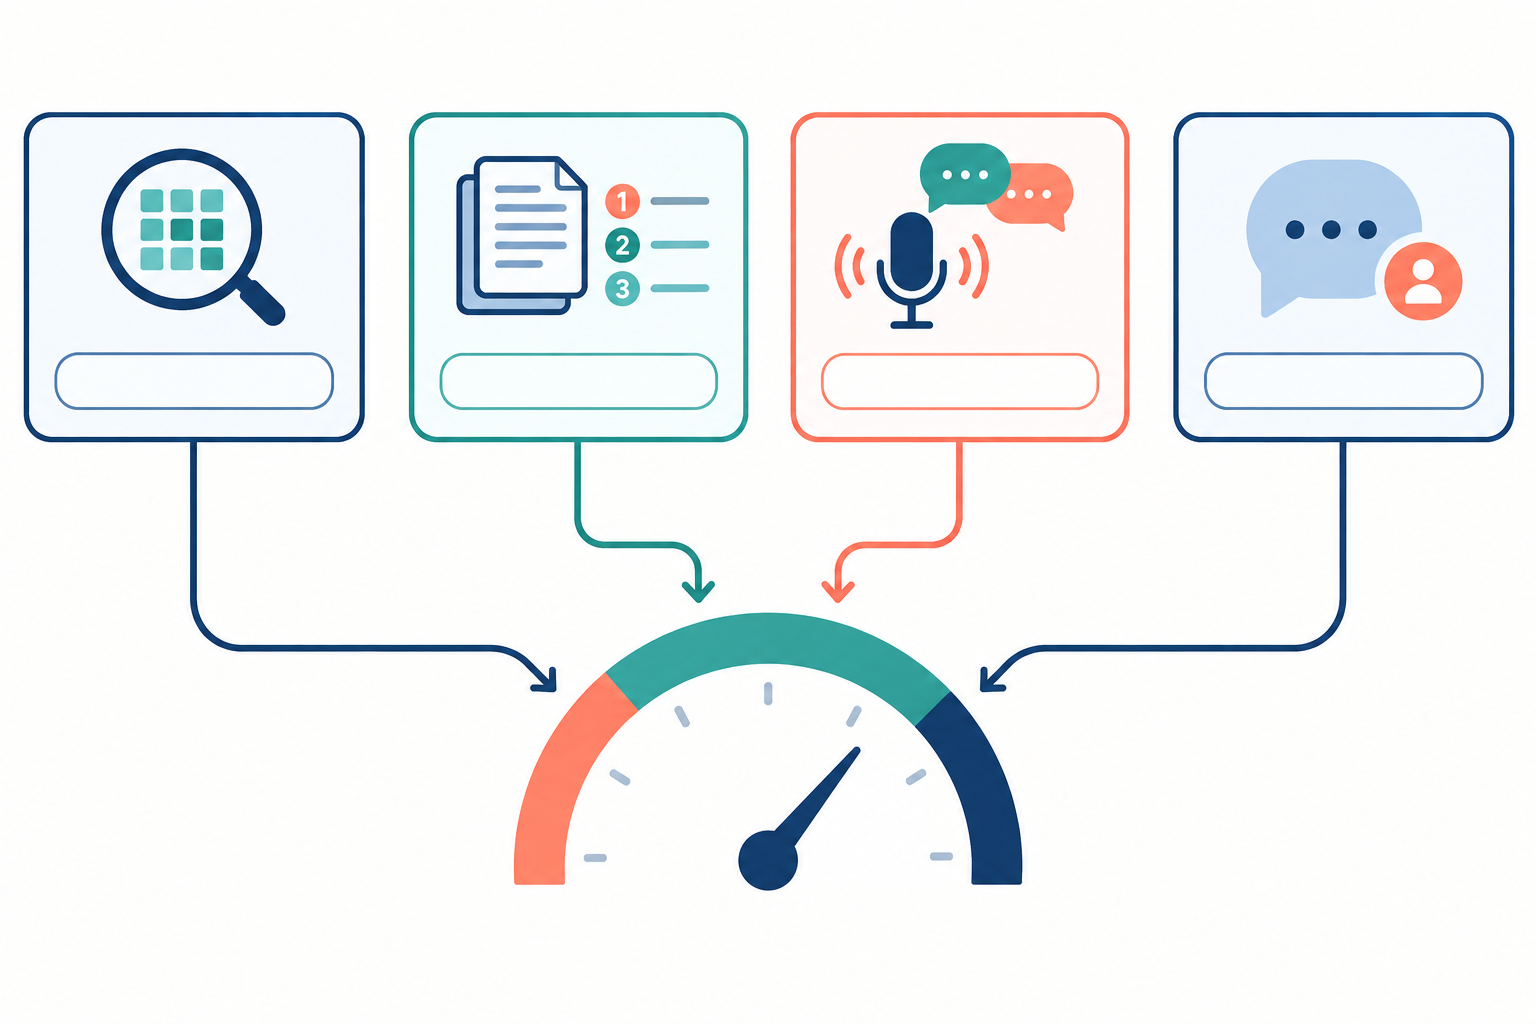
Composite scores are convenient but not standard. Many tools combine these components into one number. MentionOwl's proprietary score, for instance, runs from 0 to 100 across query coverage, position-weighted citations, share of voice and soft mentions. There is no industry-standard formula, so scores from different vendors cannot be compared. Keep the underlying components available and record the method.
The question set also has to be representative. Hand-picked prompts tend, unconsciously, to be ones where the client performs well. Better sources include questions from sales calls, support tickets and search query data, segmented by intent (category, comparison, recommendation). Tools that generate prompts by crawling a site reduce hand-picking but tend to mirror the site's own vocabulary, so supplement them with real customer language.
UK baseline checklist for AI answer tracking
A US or Australian observation cannot be assumed to represent the UK, so fix and record the following before you begin:
- UK location settings, since ChatGPT search may use approximate location
- British English phrasing in prompts, including UK terms, spellings and pound-sterling pricing
- Logged-out or consistent account state, and the same platform and feature (for example Google AI Overviews versus AI Mode)
- A competitor list reflecting UK market rivals, not just global names
UK-specific evidence on AI answer behaviour is still limited, which is one more reason to build your own baseline.
How competitors displace a brand in AI answers
Displacement does not follow a fixed script. What follows is one plausible sequence, and each step produces a signal you can observe. The signal is what you measure, and the cause is an inference to test.
- A competitor answers the exact question more directly. Signal: it appears in answers where it was previously absent.
- Third-party sources begin to favour the competitor. Reviews, comparison articles, forums and directories shift. Signal: cited sources change, with third-party pages appearing more often.
- Citations grow for them and shrink for you. Signal: falling average position and a rising share of soft mentions.
- Sentiment or framing shifts. The brand is described as a 'budget option' or an 'older tool'. Signal: sentiment moving from positive to neutral or qualified.
- Coverage diverges by platform. You may drop out on some platforms while holding on in others, which tempts teams to dismiss the pattern as noise. Signal: platform-level divergence in appearance rate. Track each platform separately and do not assume a sequence.
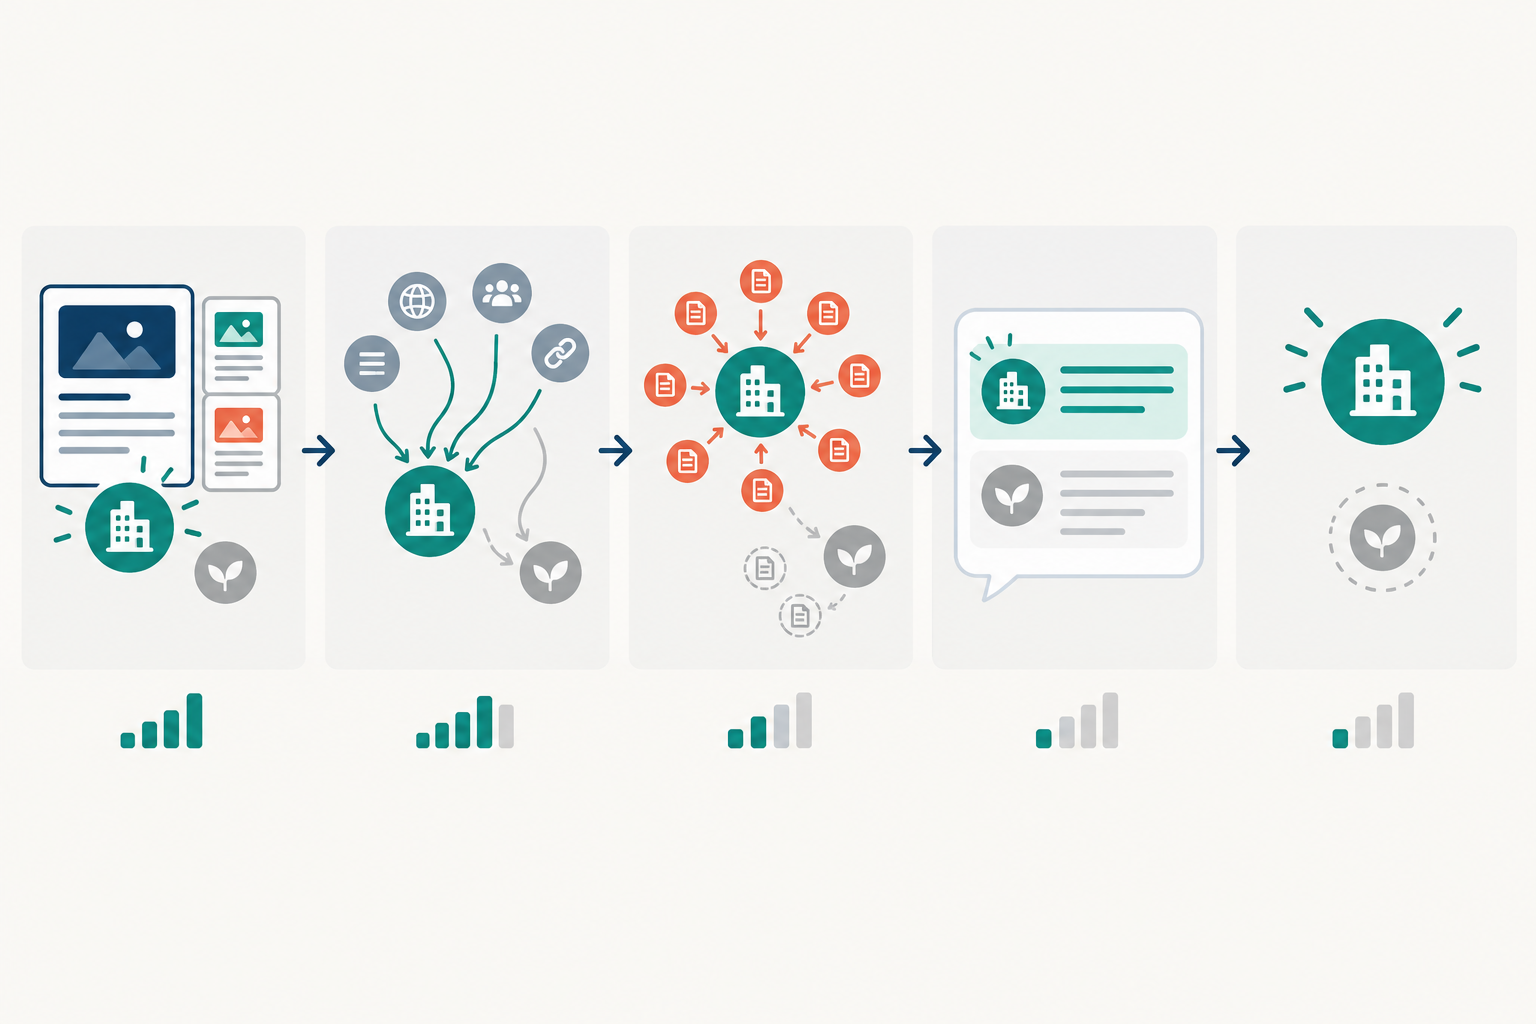
In the scenario, the week 4 slip corresponds to steps 1 and 2, the week 7 soft mention to steps 3 and 4, and the week 10 disappearance to step 5. In a real case the order could differ.
Technical problems can speed this up. Poor AI legibility, such as blocked crawlers, unclear page structure or key claims buried in unstructured text, can make a brand harder to retrieve and cite. Google says there are no special technical requirements for appearing in AI Overviews, and the usual indexing and snippet eligibility rules apply. Crawlability and sound technical SEO are prerequisites, not guarantees.
Why AI answers change: the factors behind visibility shifts
Before concluding that a client is slipping, it helps to understand why answers vary at all.
- Model and system updates. A platform can change its model, retrieval system, ranking or answer-generation behaviour at any time.
- Retrieval differences. Google says AI Overviews may use 'query fan-out', issuing related searches across subtopics and data sources, so the sources considered can differ from the results for the original query (Google documentation). ChatGPT search can rewrite a prompt into targeted queries and may use approximate location, so wording or place can alter the evidence retrieved.
- Probabilistic generation. The same question can return different brands on different runs, so a single spot check may sample an unusually good or bad draw.
- Platform differences. Platforms draw on different indexes, retrieval partners and publisher sources, and OpenAI describes ChatGPT search as using third-party search providers and partner content.
- Changes to the underlying web. New reviews, press coverage and competitor content all alter what can be found.
- Product rollouts. Google began rolling out AI Overviews in the US in May 2024 and said in October 2024 they were available in more than 100 countries and territories, reaching over 1 billion users monthly. Annotate such events on trend lines instead of treating every movement as a brand-level gain or loss.
How to separate answer variation from a genuine trend
Three working rules help. First, hold test conditions steady: record the exact prompt, platform and feature, date, country, language and, where possible, device or account context. Second, run every prompt repeatedly and report appearance rate separately from citation share, since a brand can be mentioned without being cited. Daily collection improves how quickly you see change, but only repeated runs of the same prompt reveal run-to-run variance. Third, require sustained movement, ideally corroborated on more than one platform, before calling something a trend.
Early warning signs that a client is losing AI visibility
These indicators are worth building into a weekly review. Their order will vary by client and platform.
- Falling average position, even while overall appearance rate holds.
- A rising proportion of soft mentions relative to linked citations.
- A new competitor appearing in several answers where it was previously absent.
- Sentiment drifting from recommended to neutral or qualified language.
- Loss on one platform, which is worth investigating for platform-specific causes.
- Declining coverage on high-intent questions, such as 'best', 'alternatives to' and 'which should I choose'.
- Cited sources changing, with your own pages replaced by third-party pages.
- Anecdotal reports from sales teams that prospects mention a competitor they heard about from an AI assistant.
No single item is conclusive. As a starting heuristic, not a validated rule, define a baseline (for example a four-week rolling average of appearance rate and position per platform) and open an investigation when the latest week falls outside the baseline's normal week-to-week range for two consecutive weeks. In the worked example, a fall from 62% to 48% would justify a closer look, not a conclusion. The right threshold depends on prompt volume and answer variability, so calibrate it on several weeks of data before alerting clients.
Daily AI visibility monitoring vs occasional spot checks
Many agencies begin with manual checks: someone types a few prompts into ChatGPT and screenshots the result. That is a fair place to start, but it has clear limits. In the table below, 'daily monitoring' means the full prompt set is run once per weekday on each tracked platform.
| Dimension | Occasional spot checks | Daily monitoring |
|---|---|---|
| Detection speed | Slow; problems found only when someone happens to look | Faster; week-on-week change can be flagged |
| Statistical reliability | Low; one-off answers vary run to run | Higher, because every prompt is run repeatedly and sample sizes are reported |
| Platform coverage | Patchy; depends on who checks what | Consistent across the platforms you choose |
| Competitor visibility | Anecdotal | Systematic tracking of competitor mentions and citations |
| Evidence for client reporting | Screenshots, hard to compare over time | Recorded answers, citations, sentiment and scores |
| Time cost for the agency | Low at first, rising as clients multiply | Largely automated; time goes on analysis |
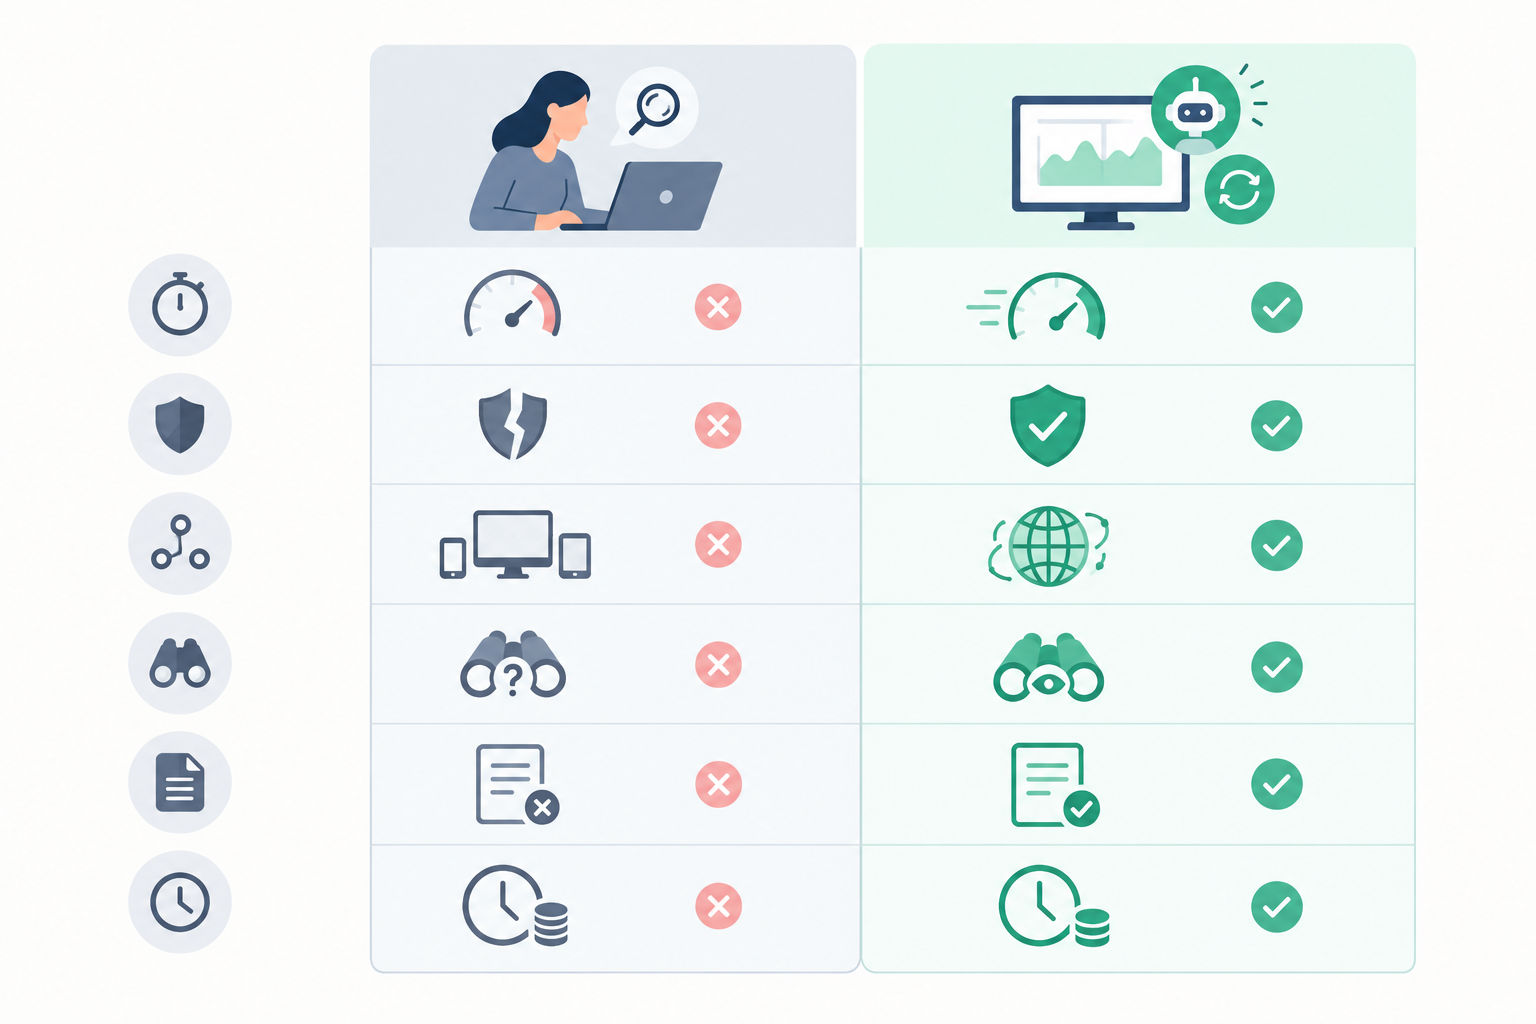
Spot checks are also prone to personalisation and prompt bias, and they miss gradual drift, which only shows when many observations are compared over time.
A workable AI visibility monitoring cadence
For most retainers I suggest daily runs of the full prompt set, a weekly review and monthly strategic reporting. With 20 prompts run once each weekday, the weekly review rests on 100 observations per platform, and the monthly report places the trend alongside organic traffic and business outcomes. If budget limits you to fewer runs, keep the unit consistent and say so in the report.
Back to Northbeam, and this is an assumption of the scenario, not a demonstrated result. Spot checks in week 1 and week 10 would have found the problem only after the damage was done, and the week 1 check would have looked healthy. Weekly monitoring might have prompted an investigation somewhere around weeks 3 to 5, depending on the alert threshold, leaving more time for corrective work.
How to respond when your brand slips in AI answers
Resist the urge to react to the first dip. A structured response works better.
- Confirm the trend. Check across multiple weeks, platforms and prompts, against your baseline and sampling uncertainty.
- Diagnose the change. Identify which questions, platforms and sources have moved, and use competitor tracking to establish who is gaining.
- Run an AI legibility audit. Check crawl access, rendering, page structure and how clearly the key claims are stated.
- Close content gaps. Publish direct, evidence-backed answers to the exact customer questions where ground was lost.
- Strengthen third-party signals. Reviews, comparison listings, press and credible mentions are among the sources platforms surface, so they deserve attention alongside owned content.
- Correct negative or inaccurate framing with factual updates at the source, rather than arguing with the model.
- Re-measure against the baseline. Generative engine optimization effects are hard to predict, so report progress against the baseline you set before the work began.
Set honest expectations with clients. Nothing is guaranteed, because platforms are not under anyone's direct control, and recovery time varies with the platform, the sources involved and the intervention. What an agency can promise is rigorous measurement and a clear diagnosis, followed by a disciplined programme of improvement. 📈
Reporting AI visibility monitoring to clients
The most useful change an agency can make is a small one: add AI share of voice alongside organic traffic in the monthly report, so a 'stable' traffic story can no longer conceal a decline. Show appearance rate, average position, citation type and named competitors per platform, state the number of runs and prompts behind each figure, and annotate known platform changes. If you use a composite score, present it as a summary of those components, not a replacement.
I would also frame AI SEO as an extension of the search and reputation work you already do. Clear content, credible third-party coverage and a technically sound site serve both classic and AI search, and in my experience clients respond better to continuity than to a new discipline that appears to displace the old one.
The next step is to pick one client, define 15 to 25 customer questions, fix the UK settings and platforms, and collect a four-week baseline before making any claims about change.
Tool note (vendor disclosure): We build MentionOwl, which runs daily question-level tracking across ChatGPT, Claude, Gemini, Copilot and Perplexity, with weekly digests and a REST API and MCP server for feeding results into agency reporting. It offers a 7-day trial for $1, priced in US dollars, so the sterling cost depends on exchange rates and card fees. The method above works with any tool, or a well-run manual process, that applies consistent definitions and repeated runs.
Frequently asked questions about AI visibility
How do I know if a competitor is overtaking me in AI answers?
Track the same customer questions on a fixed schedule, run each one repeatedly, and compare how often, and in what position, each brand appears. A competitor is likely overtaking you when its share of voice and average position rise while yours fall across several weeks and across multiple prompts, especially on high-intent questions. Competitor tracking also shows which sources are cited, which helps locate where the shift comes from, although it will not on its own prove why.
Why do AI answers change from one day to the next?
Model updates, live retrieval of different sources, the probabilistic nature of generated text, location and wording differences, and changes on the wider web all influence answers. Individual responses vary, so a single check is unreliable. Trends across repeated runs are what matter.
How often should I check AI visibility for a client?
Run the full prompt set once per weekday on each platform, review weekly (about 100 observations per platform for a 20-prompt set), and report on trends monthly. Investigate when movement against your baseline is sustained for about two weeks, and treat the first signal as a prompt to collect more data, not a verdict.
Will stable website traffic tell me my AI visibility is fine?
No. Many AI answers do not generate clicks, and AI-referred visits are often poorly attributed, so traffic can stay flat while the brand is recommended less often. Answer-level monitoring is the earlier signal.
Sources
- Pew Research Center, 'Google users are less likely to click on links when an AI summary appears in the results' (July 2025): https://www.pewresearch.org/short-reads/2025/07/22/google-users-are-less-likely-to-click-on-links-when-an-ai-summary-appears-in-the-results/
- SparkToro and Datos, '2024 Zero-Click Search Study' (2024): https://sparktoro.com/blog/2024-zero-click-search-study-for-every-1000-us-google-searches-only-374-clicks-go-to-the-open-web-in-the-eu-its-360/
- Google Search Central, 'AI features and your website' (check current version): https://developers.google.com/search/docs/appearance/ai-features
- Google, 'AI Overviews in Search' update (October 2024): https://blog.google/products/search/ai-overviews-search-october-2024/
- OpenAI Help Centre, 'ChatGPT search' (check current version): https://help.openai.com/en/articles/9237897-chatgpt-search